
Descripción
Indicadores de Pinescriptlabs Store: Pinescriptlabs Store cBots : (cBot) Gold & BTC BreakoutSession Pivots(nuevo)
PRICE ACTION (Nuevo)
Trailing Smart Algorithm (nuevo)
Mapa de Liquidación de Apalancamiento
Predicción Basada en Linreg & ATR
Soporte y Resistencia SmartTrend
Líneas
Sesiones de Brecha de Valor Justo
Análisis
Dinámico
de la Estructura
del Mercado
de
Puntos de Giro
Regresión
Lineal
Fibonacci
Multitemporal
Brecha de Valor Justo de Momentum
Proyección del Flujo del Mercado
Gradiente de Tendencia Dinámico
Rastreador de Extremos Zig-Zag
Soporte
y Resistencia
Automáticos
Líneas de Tendencia
Todos
los Niveles de
Soporte y Resistencia
Niveles
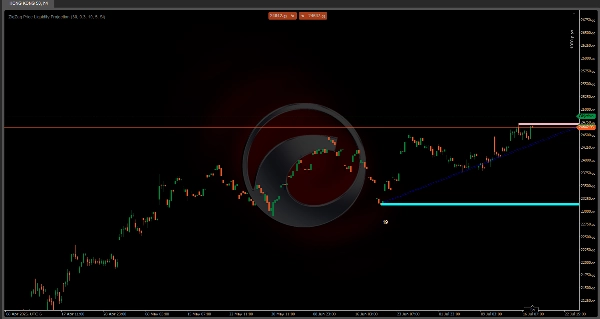
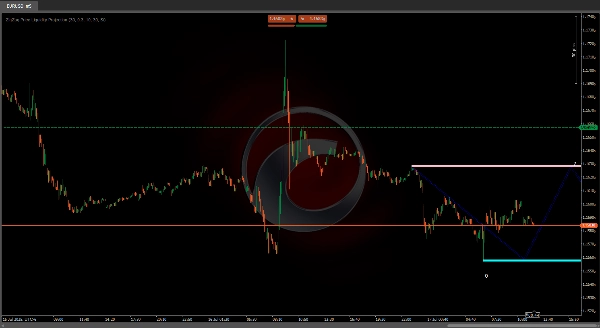
📊 Indicador de Proyección de Liquidez de Precio ZigZag
"¡Ve dónde podría girar el mercado antes de que suceda!" 🔮
Este indicador identifica niveles clave de soporte/resistencia 🛑 y predice zonas de liquidez 💧 en tu gráfico usando:
- 🔍 Puntos Pivote: Detecta máximos y mínimos significativos
- 📈 Volatilidad ATR: Mide fluctuaciones de precio para ajuste preciso
- 💦 Proyecciones de Liquidez: Anticipa áreas de alta actividad (clústeres de compra/venta) mediante patrones zigzag
🎯 Propósito: Predice zonas de reacción del precio (rebotes/rupturas/consolidaciones) para mejorar decisiones de entrada/salida
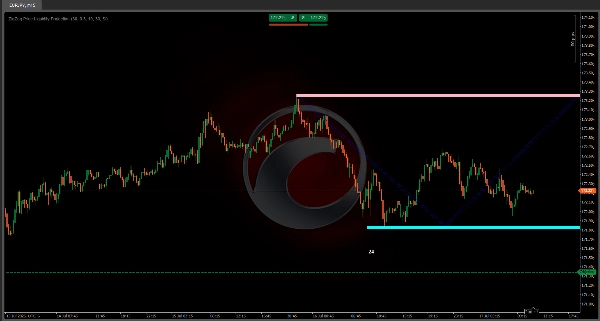
✨ La Ventaja Zigzag
Estas líneas conectadas actúan como un mapa del tesoro 🗺️ mostrando:
1️⃣ Caminos futuros del precio dentro de rangos definidos
2️⃣ Zonas potenciales de reversión donde el precio podría detenerse o revertir
3️⃣ Puntos de referencia visual para la planificación de operaciones
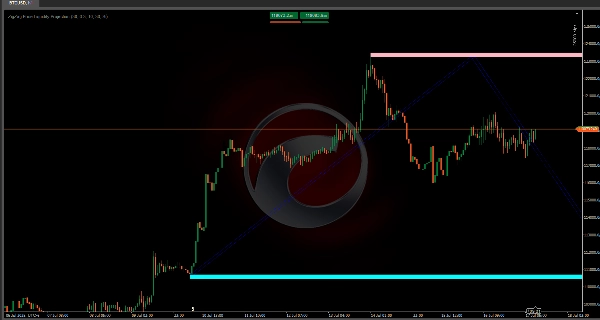
🚦 Características Clave:
- 📅 Sistema de alerta temprana para niveles importantes
- 🎯 Proyecta movimientos futuros basado en estructuras pivote (caminos alcistas/bajistas)
- 🔢 Contadores de toques (ej., "24" = 24 pruebas históricas en ese nivel)
⚙️ Configuraciones Recomendadas
ConfiguraciónValorEfecto
Periodo ATR
30
🎚️ Sensibilidad a la volatilidad
Periodo Pivote
30
🔍 Rango de significancia del pivote
⏳ Mejores Marcos Temporales: gráficos de 15min - 4hr ⏱️
💡 Consejo Profesional:
"¡Combina con patrones de velas 🕯️ para confirmación! El zigzag muestra DÓNDE podría ir el precio, las velas muestran CUÁNDO está sucediendo."
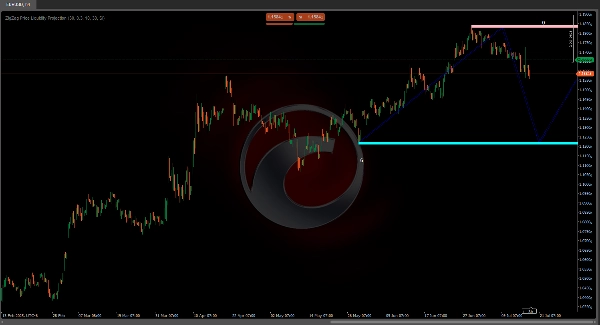
🎯 Conclusión Final:
Una poderosa herramienta visual todo en uno para detectar:
✅ Zonas de liquidez 💦
✅ Niveles críticos 🎯
✅ Caminos futuros del precio 🚀
Perfecto para traders intradía que quieren anticipar movimientos en lugar de perseguirlos 🏃💨


