
swingh6
지표
140 다운로드
버전 1.0, Mar 2025
Windows, Mac
설명
포렉스 추세 추종 전략 설명 (영어)
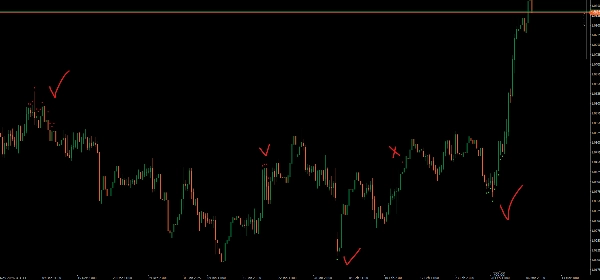
이 추세 추종 전략은 강한 시장 추세를 식별하기 위해 지수 이동평균선(EMA), MACD, 그리고 ADX를 사용합니다. 이 전략은 모멘텀과 추세 강도에 기반한 매수 및 매도 신호를 생성합니다.
작동 원리
1️⃣ 추세 방향 식별
- 빠른 EMA (21)와 느린 EMA (50)가 전체 추세 방향을 결정합니다:
-
- 강세 추세 → 빠른 EMA가 느린 EMA 위에 있습니다
- 약세 추세 → 빠른 EMA가 느린 EMA 아래에 있습니다
2️⃣ 추세 모멘텀 측정 (MACD 히스토그램)
- MACD 히스토그램이 모멘텀을 확인합니다:
-
- 강세 모멘텀 → MACD 히스토그램이 0 위에 있습니다
- 약세 모멘텀 → MACD 히스토그램이 0 아래에 있습니다
3️⃣ 추세 강도 확인 (ADX 지표)
- ADX (14)가 추세 강도를 측정합니다:
-
- 강한 추세 → ADX가 25 이상입니다
- 약한 추세 → ADX가 25 미만입니다 (신호 없음)
거래 실행
✅ 매수 신호 (강세 진입)
- 빠른 EMA > 느린 EMA (상승 추세)
- MACD 히스토그램 > 0 (모멘텀 확인)
- ADX > 25 (강한 추세)
- 🔹 매수 화살표가 저가 아래에 나타납니다
❌ 매도 신호 (약세 진입)
- 빠른 EMA < 느린 EMA (하락 추세)
- MACD 히스토그램 < 0 (모멘텀 확인)
- ADX > 25 (강한 추세)
- 🔻 매도 화살표가 고가 위에 나타납니다
주요 특징
✔ ADX를 사용하여 약한 추세를 회피
✔ MACD 확인으로 잘못된 신호 필터링
✔ 더 나은 맞춤화를 위한 조정 가능한 매개변수
이 지표는 트레이더가 강한 추세를 타고 약한 시장 상황을 피하도록 도와줍니다. 🚀
요약
지표 프로필
고객 리뷰
0.0
리뷰: 0
고객 리뷰
이 상품에 대한 리뷰가 아직 없습니다. 이미 사용해 보셨나요? 다른 사람들에게 가장 먼저 소개해 주세요!
상담
자주 묻는 질문(FAQ)
Forex
Signal
MACD
트레이딩 봇, 지표, 플러그인 등 cTrader Store에서 제공되는 상품은 제3자 개발자에 의해 제공되며, 이는 단순히 정보 및 기술적 접근을 목적으로 제공된 것입니다. cTrader Store는 중개인이 아니며, 투자 조언, 개인별 추천 또는 향후 성과에 대한 어떠한 보장도 제공하지 않습니다.


좋아하실 만한 다른 항목


가격
가입일 21/02/2025
466.3M
거래량
180.83K
핍 수익
22
판매
6.87K
무료 설치