
ORB Range with FVGs
Indikator
606 unduhan
Versi 1.0, Sep 2025
Windows, Mac
1.0
Ulasan: 1
Deskripsi
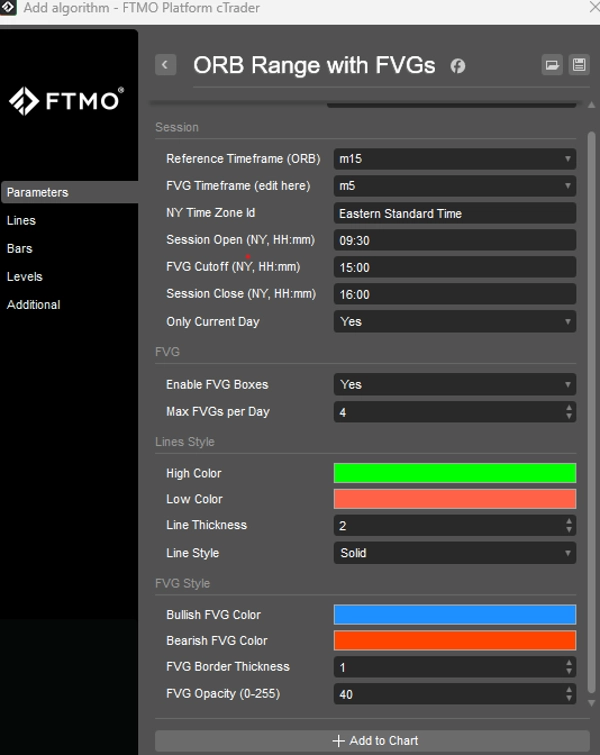
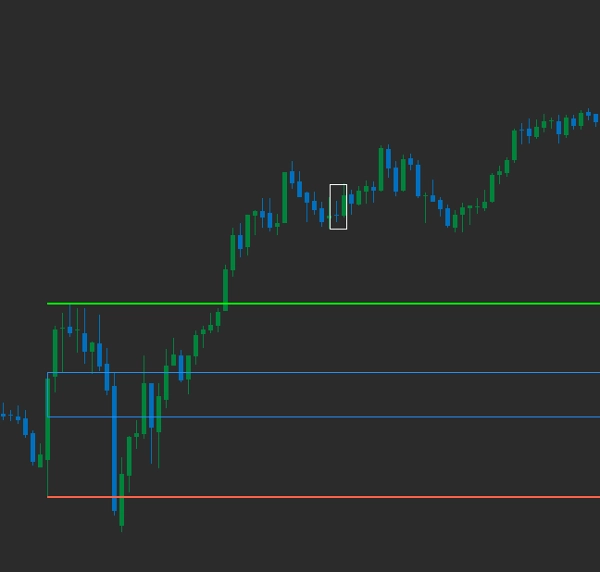
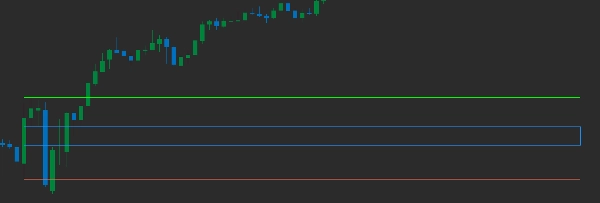
- Indikator ini menggambarkan rentang pembukaan 15 menit dari sesi NY dengan FVG pertama yang ditampilkan di grafik setelah pembukaan
Pengguna dapat:
Mengubah awal dan akhir ORB untuk menyesuaikan sesi lain.
Menentukan kerangka waktu FVG yang akan digambarkan.
Mengedit warna sesuai preferensi Anda.
Perlu dicatat bahwa ini hanya sebuah indikator dan tidak dibuat untuk nasihat keuangan dalam bentuk apapun.
Berikan saya umpan balik Anda untuk perbaikan lebih lanjut.
Terima kasih
Ringkasan
Ringkasan AI
The ORB Range with FVGs indicator plots the 15-minute opening range of the New York trading session on the chart, along with the first N Fair Value Gaps (FVGs) that appear after the session opens. Users can customize the indicator by adjusting the opening range start and end times to accommodate other trading sessions. Additionally, the timeframe for the FVGs displayed can be defined according to user preference. Color settings are also editable to match individual chart styles. This tool is designed to assist traders analyzing Forex, indices, and popular symbols such as EURUSD, GBPUSD, XAUUSD, NAS100, and USDJPY. It supports strategies including breakout and scalping by visually highlighting key price ranges and imbalances. The indicator serves as a visual aid and does not provide financial advice.
Profil indikator
Ulasan pelanggan
1.0
Ulasan: 1
5 | 0 % | |
4 | 0 % | |
3 | 0 % | |
2 | 0 % | |
1 | 100 % |
Diskusi
Pertanyaan umum
Forex
Breakout
Scalping
Indices
EURUSD
GBPUSD
Fair Value Gap
XAUUSD
NAS100
USDJPY
Produk-produk yang tersedia melalui cTrader Store, termasuk bot trading, indikator, dan plugin, disediakan oleh pengembang pihak ketiga serta hanya ditujukan untuk akses teknis dan informasi. cTrader Store bukan broker dan tidak menyediakan saran investasi, rekomendasi pribadi, atau jaminan apa pun tentang kinerja di masa mendatang.
Produk lain dari penulis ini


![Logo "High-Low Divergence [Iridio Capital]"](https://cdn.ctrader.com/image/webp/443c4661-7abb-40f1-842f-4b6ec560649b_40914)


Harga
Sejak 30/01/2025
36.05M
Volume trading
26.73K
Pip dimenangkan
1.24K
Instal gratis