
Deskripsi
🚀 Lebih dari 10.000 trader sudah menggunakan indikator TOP kami 🏆
Temukan mengapa para profesional memilih kami – alat paling kuat di cTrader (indikator, algoritma, dan cBots) menunggu Anda.
👉 Dapatkan semua sistem TOP kami di sini:
_______________________________________________
📌 Indikator Struktur Pasar
· ✅ AdvancedMarket Structure: Bos, Choch, SwinLevels, Order Blocks, Market Structure& Liquidity Finder
· 🔄 Dynamic Market StructureAnalysis of Turning Points
· 🧱 Order Block
· ⚖️ Market Imbalance
· ⛓️ BOS & CHOCH
· 🧠 ICT Power of 3
_______________________________________________
🔚 Sistem Keluar Pintar
_______________________________________________
📐 Indikator ZigZag
· 🔍 ZigZag Price LiquidityProjection
· ➖ ZigZag
_______________________________________________
🧱 Indikator Support & Resistance
· 🟩 SmartTrend Support &Resistance Lines
· 🧱 All Support and ResistanceLevels
_______________________________________________
📊 Indikator Tren & Saluran
· 📊 Supertrend
_______________________________________________
💧 Alat Volume & Likuiditas
_______________________________________________
⚡ Indikator Momentum & RSI
· 🔎 Multi-Level Candle Bias
Tracker
_______________________________________________
🔮 Alat Prediksi & Proyeksi
· 📐 Prediksi Berdasarkan Linreg& ATR
· 📏 Regresi Linear FibonacciMulti-timeframe
· 📈 Volume-Powered Market Flow Projector
______________________________________________________________________________________________
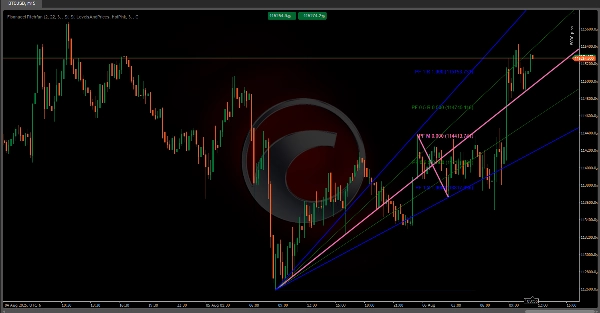
Fibonacci Pitchfan 📊✨
Sebuah indikator teknis lanjutan yang menggabungkan deteksi pivot, garis tren dinamis, dan level Fibonacci untuk menciptakan alat visual yang membantu trader mengidentifikasi tren, zona support/resistance, dan potensi titik pembalikan. 🎯 Sangat dapat disesuaikan, alat ini menyesuaikan dengan berbagai gaya trading melalui parameter yang dapat dikonfigurasi. Berikut adalah rincian logika dan perhitungannya.
Komponen Utama 🔧
Indikator ini mengandalkan tiga elemen kunci yang bekerja bersama:
1. Deteksi Pivot 🔄
- Mengidentifikasi titik pembalikan harga utama (pivot tinggi/rendah).
- Menggunakan rentang bar yang ditentukan pengguna (kedalaman pivot) untuk menentukan apakah sebuah bar adalah tinggi/rendah signifikan dibandingkan bar di sekitarnya.
- Menyaring noise dengan mengharuskan pivot melewati ambang deviasi berbasis ATR, memastikan hanya ayunan harga yang relevan yang dipertimbangkan.
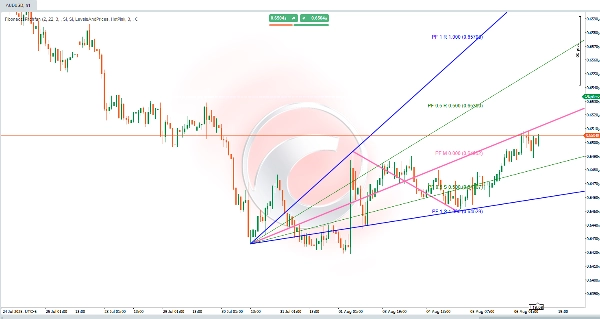
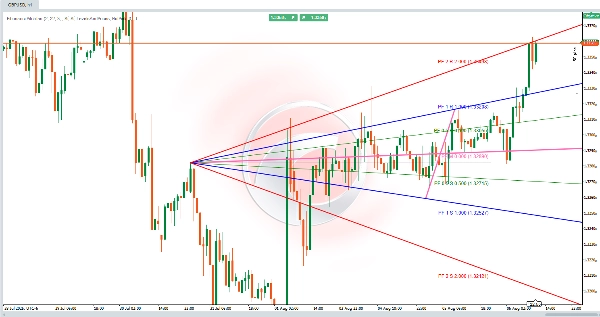
2. TrendFan & Level Fibonacci 📐
- Memproyeksikan kipas garis tren dinamis dari pivot historis ke masa depan, menggunakan level yang telah ditentukan (misalnya, 0.25, 0.5, 1.0) untuk menandai potensi support/resistance.
- Level Fibonacci opsional (garis horizontal) menyoroti retracement/ekstensi antara pivot utama.
Logika Perhitungan 🧮
1. Identifikasi Pivot
- Untuk setiap bar, algoritma memindai rentang simetris dari bar sebelumnya/berikutnya (berdasarkan kedalaman pivot).
- Sebuah pivot tinggi dikonfirmasi jika harga tertinggi bar tersebut adalah tertinggi dalam rentang; sebuah pivot rendah jika harga terendahnya adalah terendah.
- Ambang deviasi (persentase ATR relatif terhadap harga) menyaring fluktuasi kecil, fokus pada pergerakan pasar yang berarti.
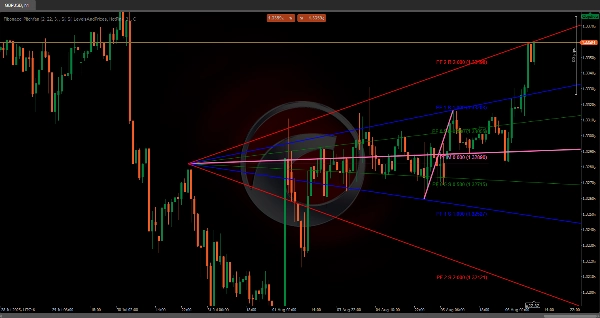
2. Generasi TrendFan 🌪️
- Sebuah pivot historis referensi (dapat dikonfigurasi) dipasangkan dengan pivot terbaru untuk membentuk garis dasar.
- Sebuah garis median digambar di antara keduanya, dan garis tren yang diproyeksikan (pada level yang telah ditentukan) diperpanjang ke masa depan, menciptakan "kipas" dari zona harga utama.
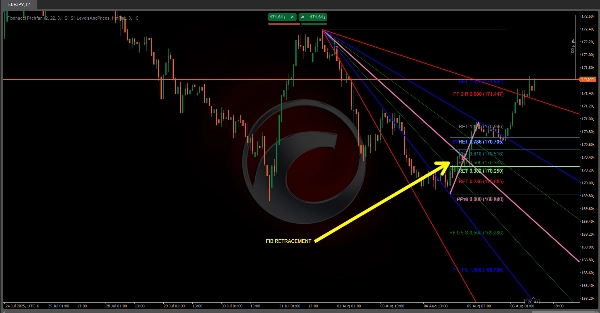
3. Proyeksi Fibonacci 🔢
- Level retracement (misalnya, 0.236, 0.5, 0.618) menandai potensi area pullback dalam pergerakan harga sebelumnya.
- Level ekstensi memproyeksikan target harga di luar rentang awal, disesuaikan dengan arah tren.
- Level dapat dibalik atau diperpanjang berdasarkan pengaturan pengguna.
Pengaturan yang Dapat Disesuaikan ⚙️
- Ambang Deviasi: Menyesuaikan sensitivitas terhadap pergerakan harga (berbasis ATR).
- Kedalaman Pivot: Menentukan rentang bar untuk deteksi pivot (mempengaruhi frekuensi sinyal).
- Referensi Historis: Menetapkan seberapa jauh pivot awal dipilih untuk TrendFan.
- Visibilitas: Mengaktifkan tampilan TrendFan/Fibonacci dan memilih level tertentu untuk ditampilkan.
Kesimpulan 🏆
Fibonacci Pitchfan adalah alat all-in-one yang kuat untuk trader yang mencari pandangan yang jelas dan dinamis tentang struktur pasar. Dengan menggabungkan pivot, garis tren, dan level Fibonacci, alat ini memberikan wawasan yang dapat ditindaklanjuti untuk mengantisipasi pergerakan harga dan membuat keputusan yang tepat. 🚀
Ringkasan
It generates a "TrendFan" by projecting dynamic trendlines from a configurable historical pivot to the latest pivot, creating a fan of key price zones. Optional Fibonacci retracement and extension levels highlight potential pullback areas and price targets, which can be customized or inverted according to user preferences.
Key customizable settings include deviation threshold sensitivity, pivot depth (bar range for pivot detection), historical reference for the initial pivot selection, and visibility options for TrendFan and Fibonacci levels. This tool is suitable for traders seeking actionable insights to anticipate price movements and make informed decisions based on a comprehensive view of market dynamics.


