
Description
Si vous recherchez un indicateur de canal Fibonacci dynamique pour cTrader, ne cherchez pas plus loin. Cet indicateur trace automatiquement des bandes de Fibonacci parallèles à une moyenne mobile de votre choix. Il est convivial et, comme mes autres indicateurs, fournit des alertes via des pop-ups, des sons, des emails et des messages Telegram. De plus, vous avez la flexibilité de personnaliser les bandes, les niveaux de Fibonacci et les alertes.
Voici une liste de ses fonctionnalités :
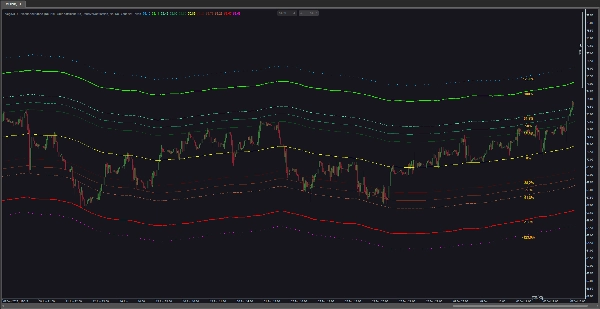
- Calcul des bandes de Fibonacci : L'indicateur calcule et trace des bandes de Fibonacci basées sur la moyenne mobile que vous avez sélectionnée. Ces bandes proviennent des niveaux de Fibonacci (par exemple, 0,0 %, 38,2 %, 61,8 % ou d'autres) et s'étendent au-dessus et en dessous de la moyenne mobile selon un facteur spécifié.
- Configuration de la moyenne mobile : Personnalisez le type de moyenne mobile (par exemple, simple, exponentielle, etc.) et le nombre de périodes utilisées dans le calcul. La moyenne mobile sert de base aux bandes de Fibonacci.
- Fonctionnalité d'alerte : L'indicateur offre diverses options d'alerte pour notifier les traders de certains événements. Cela inclut des alertes de contact avec un niveau de prix et des alertes de proximité.
- Alertes de contact avec un niveau de prix : Configurez l'indicateur pour déclencher des alertes lorsque le prix touche des niveaux spécifiques de Fibonacci. Les alertes peuvent être basées sur le prix de clôture ou immédiatement lorsque le prix touche le niveau.
- Alertes de proximité : Configurez des alertes de proximité pour recevoir des notifications lorsque le prix s'approche ou s'éloigne d'un niveau de Fibonacci spécifié dans une distance définie. Les alertes peuvent se déclencher lorsque le prix approche ou s'éloigne du niveau.
- Options de sortie des alertes : Choisissez parmi les alertes sonores, les pop-ups, les messages Telegram et les notifications par email pour les alertes. Les alertes sonores peuvent être personnalisées en sélectionnant différents fichiers sonores.
- Options de visualisation : Personnalisez la visualisation des niveaux de Fibonacci avec des options telles que l'affichage des valeurs en pourcentage, la définition de la couleur des étiquettes de pourcentage, le contrôle de l'emplacement des étiquettes sur le graphique, l'activation/désactivation de bandes spécifiques, et le choix de la couleur, de l'épaisseur et de l'apparence des bandes.
- Niveaux de Fibonacci configurables : Adaptez l'indicateur à votre stratégie de trading en ajustant les niveaux spécifiques de Fibonacci utilisés dans le calcul. Les niveaux de Fibonacci positifs et négatifs peuvent être personnalisés individuellement.
- Guide utilisateur intégré : Vous pouvez accéder au guide utilisateur de cet indicateur directement depuis le graphique.
En résumé, l'indicateur VegaXLR - Fibonacci Bands combine l'analyse de Fibonacci et les moyennes mobiles pour aider à identifier les niveaux potentiels de support et de résistance. Avec une fonctionnalité d'alerte configurable et des options de visualisation, c'est un outil inestimable pour les traders qui s'appuient sur les retracements ou extensions de Fibonacci.
Résumé
It features multiple alert options including price level touch alerts—triggered on price contact or close at specified Fibonacci levels—and proximity alerts that notify when price approaches or moves away from these levels within a defined range. Alerts can be delivered via pop-up, sound (with customizable sounds), email, and Telegram messages.
Visualization settings enable customization of band colors, thickness, label display and position, and selective enabling or disabling of bands. A built-in user guide is accessible directly from the chart for ease of use.
Overall, VegaXLR - Fibonacci Bands combines Fibonacci retracement and expansion analysis with moving averages to assist traders in identifying potential support and resistance zones, enhanced by configurable alerts and visualization options.
Avis clients
5 | 100 % | |
4 | 0 % | |
3 | 0 % | |
2 | 0 % | |
1 | 0 % |


