
Mô tả
Delta Peak Bubbles được xây dựng dành cho các nhà giao dịch muốn một cách nhanh chóng, trực quan để xác định “nơi thị trường đang làm việc” trên biểu đồ tick. Thay vì làm rối màn hình của bạn với các bảng điều khiển bổ sung, nó vẽ các bong bóng rõ ràng, có cấp độ trực tiếp trên biểu đồ để tiết lộ các đợt hoạt động cường độ cao theo thời gian thực.
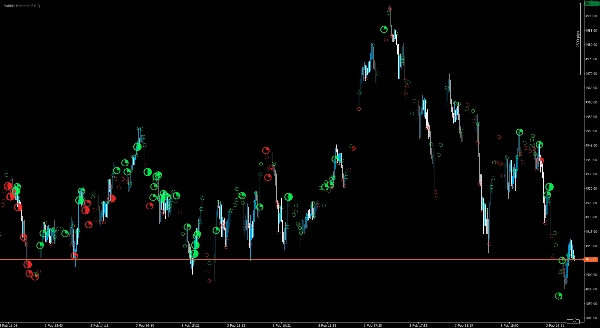
Chỉ báo tập trung vào các khoảnh khắc đỉnh điểm trong mỗi thanh và trực quan hóa chúng với thang đo sức mạnh dễ đọc (từ các vòng tròn tinh tế đến một ngôi sao nổi bật cho các sự kiện mạnh nhất). Bong bóng được mã màu để cung cấp ngữ cảnh hướng nhanh, giúp dễ dàng phân biệt áp lực tăng giá và giảm giá chỉ trong nháy mắt.
Được thiết kế cho các quy trình giao dịch thực tế, Delta Peak Bubbles hoạt động đặc biệt tốt cho:
- Giao dịch lướt sóng và giao dịch động lượng ngắn hạn
- Xác nhận phá vỡ và theo dõi xung lực
- Xác định các vùng phản ứng và điểm kiệt sức tiềm năng
- Thêm “lớp nhiệt” vào các chiến lược Price Action / SMC / mức quan trọng
Hướng dẫn sức mạnh bong bóng
Các bong bóng được phân loại thành bốn cấp độ sức mạnh để giúp bạn nhanh chóng phân biệt hoạt động bình thường với các đỉnh cao tác động lớn:
- Cấp 1 – Thấp:
○(đỉnh nhỏ) - Cấp 2 – Trung bình:
◔(đỉnh vừa phải) - Cấp 3 – Cao:
◑(đỉnh mạnh) - Cấp 4 – Cực đoan:
★(đỉnh rất mạnh / nổi bật)
Màu sắc biểu thị áp lực hướng (xanh lá = tăng giá, đỏ = giảm giá).
Các điều khiển hiển thị giúp giao diện sạch sẽ trên mọi bố cục, bao gồm cả màn hình 4K, để bạn có thể giữ biểu đồ dễ đọc trong khi vẫn nhìn thấy các khoảnh khắc quan trọng.
Tuyên bố từ chối trách nhiệm: Giao dịch/Đầu tư có rủi ro đáng kể và có thể dẫn đến mất toàn bộ vốn đầu tư. Chỉ báo này được cung cấp chỉ nhằm mục đích thông tin và phân tích và không cấu thành lời khuyên tài chính, đề nghị hay khuyến nghị nào. Việc sử dụng hoàn toàn là rủi ro của bạn; bạn chịu trách nhiệm duy nhất về tất cả các quyết định và kết quả giao dịch. Nhà cung cấp không đưa ra bất kỳ tuyên bố hay bảo đảm nào (rõ ràng hoặc ngụ ý) về độ chính xác, đầy đủ, kịp thời, hiệu suất, khả năng thương mại hoặc sự phù hợp cho một mục đích cụ thể. Trong phạm vi pháp luật cho phép, nhà cung cấp sẽ không chịu trách nhiệm về bất kỳ tổn thất trực tiếp hoặc gián tiếp, thiệt hại hoặc lợi nhuận bị mất nào phát sinh từ hoặc liên quan đến việc sử dụng chỉ báo này (bao gồm, nhưng không giới hạn, các tổn thất do điều kiện thị trường, sự cố dữ liệu/nền tảng, lỗi cấu hình hoặc sử dụng sai). Hiệu suất trong quá khứ không phải là chỉ báo đáng tin cậy cho kết quả trong tương lai.
Tóm tắt
Đánh giá của khách hàng
5 | 33 % | |
4 | 67 % | |
3 | 0 % | |
2 | 0 % | |
1 | 0 % |


