
Cross EMA Pro
Wskaźnik
2 zakupy
Wersja 1.0, Sep 2024
Windows, Mac
4.5
Opinie: 2
Opis
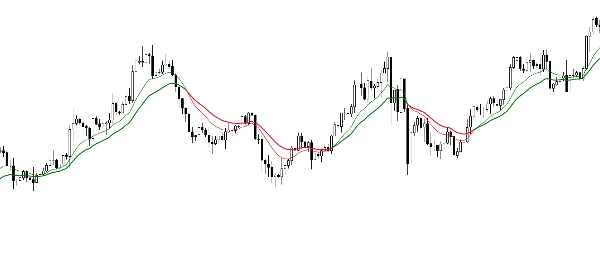
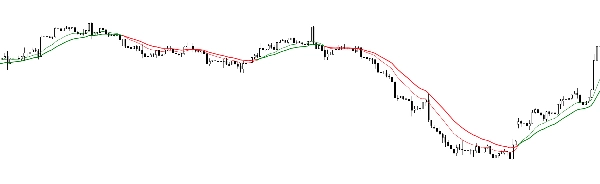
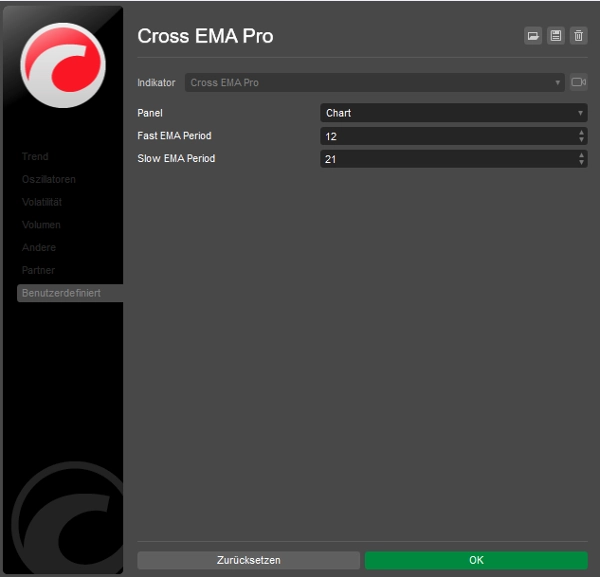
Cross EMA Pro pomaga dokładnie zidentyfikować odwrócenia trendu poprzez wizualizację przecięcia średnich kroczących EMA o okresach 12 i 21. Kodowanie kolorami ułatwia szybkie rozpoznanie kierunków trendu.
- Sygnały przecięcia: Oparte na EMA o okresach 12 i 21
- Kodowanie kolorami: Zielony dla trendów wzrostowych, czerwony dla trendów spadkowych
- Elastyczne zastosowanie: Odpowiedni do skalpowania, day tradingu i strategii długoterminowych
Podsumowanie
Podsumowanie AI
Cross EMA Pro is a trend reversal indicator that visualizes the crossover of 12-period and 21-period exponential moving averages (EMAs). It uses color coding—green for uptrends and red for downtrends—to help users quickly identify trend directions. The indicator provides clear crossover signals based on these two EMAs, making it suitable for various trading styles including scalping, day trading, and long-term strategies. It supports multiple markets such as Forex, stocks, indices, commodities, and cryptocurrencies including BTCUSD and XAUUSD. The indicator outputs visual signals on price charts to assist traders in recognizing potential trend reversals.
Profil wskaźnika
Kategoria wskaźnika
Trend
Typ wyjścia
Wizualizacja
Wymagania dotyczące danych
Tylko słupki
Opinie klientów
4.5
Opinie: 2
5 | 50 % | |
4 | 50 % | |
3 | 0 % | |
2 | 0 % | |
1 | 0 % |
Opinie klientów
September 22, 2024
September 22, 2024
No reason to yolo this live without a few normal sessions, and M15 is enough for the first pass.
Dyskusja
Częste pytania
BTCUSD
Forex
Indices
Commodities
Crypto
Stocks
XAUUSD
Produkty dostępne za pośrednictwem cTrader Store, w tym boty handlowe, wskaźniki i wtyczki, dostarczane są przez deweloperów zewnętrznych i udostępniane wyłącznie w celach informacyjnych oraz w celu zapewnienia dostępu technicznego. cTrader Store nie jest brokerem i nie zapewnia doradztwa inwestycyjnego, nie udziela spersonalizowanych rekomendacji ani nie gwarantuje przyszłych wyników.
Więcej od tego autora


Cena
Od 11/09/2024
7
Sprzedaż