
Footprint Chart_noSourceCode
Wskaźnik
1 zakupy
Wersja 1.0, Sep 2025
Windows, Mac
4.3
Opinie: 3
Opis
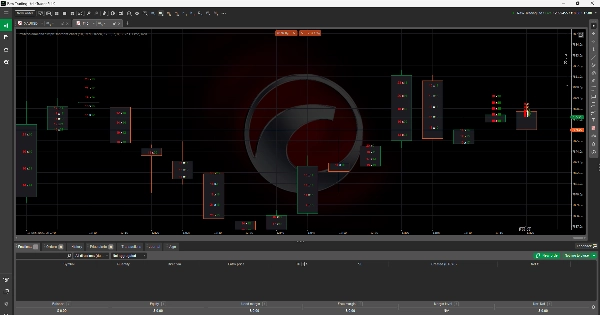
wskaźnik wykresu footprint
Wskaźnik wykresu Footprint zapewnia traderom szczegółowy widok przepływu zleceń, wyświetlając wolumen zleceń kupna i sprzedaży bezpośrednio w każdej świecy cenowej. W przeciwieństwie do tradycyjnych wykresów świecowych, to narzędzie pozwala użytkownikom zobaczyć, gdzie skoncentrowana jest presja kupna i sprzedaży na określonych poziomach cenowych. Poprzez podkreślanie nierówności między kupującymi a sprzedającymi, oferuje głębszy wgląd w głębokość rynku, płynność i aktywność handlową. Czyni to z niego niezbędne narzędzie dla traderów dążących do udoskonalenia momentów wejścia, wyjścia oraz zarządzania ryzykiem poprzez zaawansowaną analizę przepływu zleceń.
Podsumowanie
Podsumowanie AI
The Footprint Chart Indicator enhances traditional candlestick charts by displaying bid and ask volumes within each price candle. This visualization allows traders to observe buying and selling pressure at specific price levels, revealing imbalances between buyers and sellers. By providing detailed insights into order flow, market depth, liquidity, and trading activity, the indicator supports more precise trade entries, exits, and risk management decisions. It is applicable across various markets including Forex, cryptocurrencies (e.g., BTCUSD), commodities, indices, and stocks. The tool is designed for traders who utilize advanced order flow analysis to refine their strategies.
Profil wskaźnika
Opinie klientów
4.3
Opinie: 3
5 | 67 % | |
4 | 0 % | |
3 | 33 % | |
2 | 0 % | |
1 | 0 % |
Opinie klientów
September 29, 2025
This fits volume based context better as a review layer. The first forward check can be 97 setups on M1, with 20 reactions and manual notes.
September 26, 2025
More useful for someone who wants less noise in the process. The best use is checking participation and pressure, then leaving the final filter manual.
September 23, 2025
I liked it more as a confirmation layer for volume based context than as something to follow blindly. Pressure is easier to read, and the final decision still feels like it belongs to the trader. Light sizing makes the early sample easier to judge.
Dyskusja
Częste pytania
BTCUSD
Forex
Signal
Indices
EURUSD
Commodities
GBPUSD
NZDUSD
Prop
Scalping
Crypto
Stocks
XAUUSD
NAS100
USDJPY
Produkty dostępne za pośrednictwem cTrader Store, w tym boty handlowe, wskaźniki i wtyczki, dostarczane są przez deweloperów zewnętrznych i udostępniane wyłącznie w celach informacyjnych oraz w celu zapewnienia dostępu technicznego. cTrader Store nie jest brokerem i nie zapewnia doradztwa inwestycyjnego, nie udziela spersonalizowanych rekomendacji ani nie gwarantuje przyszłych wyników.
Więcej od tego autora


Cena
Od 15/01/2025
7
Sprzedaż