
説明
The Multi-Timeframe ADX Trend Dots & Arrows は、cTrader向けのプロフェッショナルなトレーディングインジケーターで、平均方向性指数(ADX)を使用して複数の時間枠にわたる整合した市場トレンドを識別するよう設計されています。
🔹 主な特徴:
- ✅ 最大4つのカスタマイズ可能な時間枠(M15、H1、H4、日足)を分析。
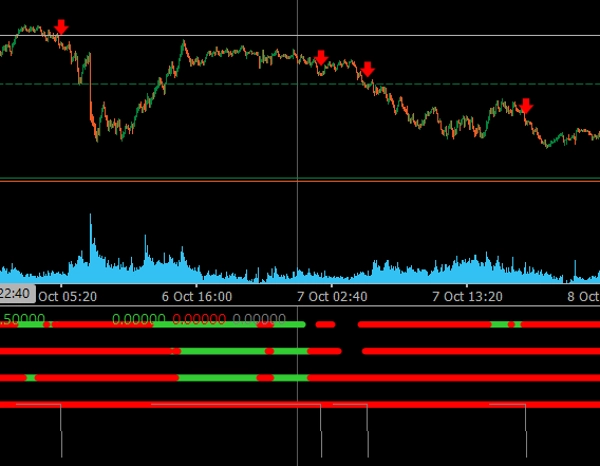
- ✅ 色付きのドットが方向性のバイアスを示します(緑=上昇トレンド、赤=下降トレンド)。
- ✅ すべての時間枠が同じ方向に一致したときに自動的に矢印が表示されます。
- ✅ 連続バーのフィルターにより、誤ったまたは早すぎるシグナルを減らします。
- ✅ ダークおよびライトのチャートテーマの両方に最適化されたクリーンでモダンなビジュアライゼーション。
- ✅ マルチタイムフレームの確認およびトレンド継続ポイントの発見に最適です。
このインジケーターは、大局を見たいトレーダーに理想的で、すべての時間枠が一致したときのみエントリーすることで、より強力で信頼性の高いトレードセットアップを提供します。
概要
AIによる概要
The ADXMultiframeIndicator is a trading indicator for the cTrader platform that identifies market trends by analyzing the Average Directional Movement Index (ADX) across multiple timeframes. It supports up to four customizable timeframes, including M15, H1, H4, and Daily. The indicator displays colored dots to indicate directional bias—green for uptrends and red for downtrends—and automatically shows arrows when all selected timeframes align in the same direction. A consecutive bars filter is included to reduce false or premature signals. The visualization is designed to be clear and modern, compatible with both dark and light chart themes. This tool assists traders in confirming multi-timeframe trends and identifying trend continuation points by highlighting when all timeframes agree, facilitating more informed trade entries. It is particularly useful for analyzing indices markets.
インジケーターのプロフィール
カスタマーレビュー
5.0
レビュー: 2
5 | 100 % | |
4 | 0 % | |
3 | 0 % | |
2 | 0 % | |
1 | 0 % |
カスタマーレビュー
October 28, 2025
the first signal should not decide the only input, but it can look better than it is during a lucky run.
ディスカッション
よくあるご質問
Indices
cTrader Storeで入手可能な取引ボット、インジケーター、プラグインなどの商品は、第三者の開発者が提供するものであり、情報と技術の取得のみを目的としてご利用いただけます。cTrader Storeはブローカーではなく、投資助言や個人的な推奨を行うことも、将来のパフォーマンスを保証することもありません。
この作成者の他の商品


価格
登録日 21/01/2025
3
販売