
Mô tả
📌 CandleColourFlow_EURCAD_DEMO_1_1 – Phiên bản Demo (NÂNG CẤP)
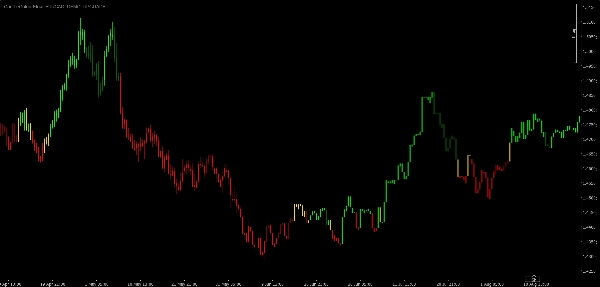
CandleColourFlow là một chỉ báo sáng tạo được thiết kế để làm nổi bật rõ ràng và nhanh chóng hướng đi của xu hướng và sức mạnh động lượng trên thị trường Forex.
Phiên bản EURCAD Demo 1.1 (Nâng cấp) có tính năng tô màu nến cải tiến giúp xác định các xung lực, sự chậm lại và vùng trung tính với độ rõ nét hình ảnh cao.
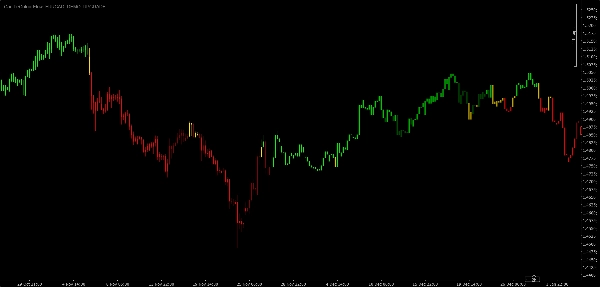
🔹 Hệ thống Màu Nến (Phiên bản Demo)
Xanh Lá Sáng – xung lực tăng mạnh
Chỉ ra sự thống trị rõ ràng của người mua và hỗ trợ giữ hoặc mở các giao dịch mua.
Xanh Lá Đậm – xu hướng tăng đang suy yếu
Động lượng đang giảm dần.
Điều này có thể báo hiệu cơ hội thoát tiềm năng sau một đợt tăng kéo dài.
Đỏ Sáng – xung lực giảm mạnh
Áp lực bán đang chiếm ưu thế và ủng hộ việc tiếp tục các giao dịch bán khống.
Đỏ Đậm – xu hướng giảm đang suy yếu
Động lượng đang mất sức mạnh.
Điều này có thể chỉ ra kết thúc có thể của đợt di chuyển, phù hợp để đóng các vị thế bán.
Nến Vàng – thị trường trung tính
Không có lợi thế hướng đi rõ ràng.
Thường xuất hiện trong giai đoạn tích lũy hoặc tạm dừng trước khi tiếp tục.
💡 Điều gì làm cho CandleColourFlow Demo 1.1 trở nên độc đáo?
- Đánh giá trực quan ngay lập tức về sức mạnh xu hướng (màu sáng so với màu tối)
- Giúp nhà giao dịch nhanh chóng đánh giá điều kiện thị trường mà không cần nhiều chỉ báo
- Đơn giản và trực quan cho người mới bắt đầu
- Phiên bản demo sạch sẽ, không gây phân tâm
⚠️ Tuyên bố từ chối trách nhiệm pháp lý
Chỉ báo này chỉ nhằm mục đích giáo dục.
Nó không cấu thành lời khuyên tài chính hay khuyến nghị thực hiện giao dịch.


![Logo "Smart Money Concepts (SMC) [Iridio Capital]"](https://cdn.ctrader.com/image/webp/28b69fd1-ef54-4bed-9487-07e78e883be4_40934)