
说明
SR Commander
免费试用 Big Brother: SR Commander 多时间框架 https://ctrader.com/products/3833?u=ALGO-XL
SR Commander 是一个干净且智能的 cTrader 支撑与阻力指标,旨在帮助交易者识别关键市场水平,瞬间读取价格位置,并更快地对突破、跌破和拒绝情形做出反应。
SR Commander 不会用不必要的噪音来杂乱图表,而是专注于最重要的内容:当前价格附近的可操作 支撑 和 阻力 水平,结合一个简单的视觉状态系统,告诉您市场处于 买入、卖出 或 等待 状态。
这使得它特别适合那些希望快速、结构化地查看市场行为,而无需手动在每个图表上标记水平的交易者。
SR Commander 的工作原理
SR Commander 扫描最近的价格动作,并识别所选回溯逻辑中最重要的蜡烛图。它结合基于波动率的计算,构建当前市场价格周围有意义的支撑和阻力水平。
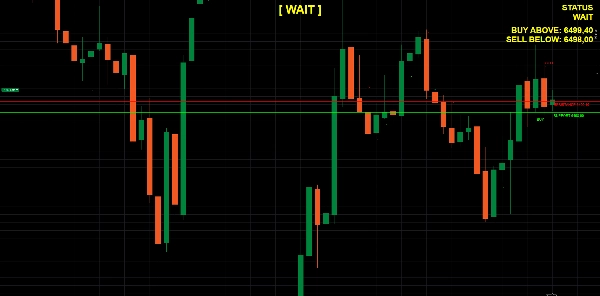
从这些检测到的水平中,指标会自动选择 价格下方最近的支撑 和 价格上方最近的阻力。这些水平随后直接绘制在图表上,作为清晰的水平线,让您立即了解价格当前在市场结构中的位置。
一旦这些水平确定,SR Commander 会评估当前的市场状况:
- 买入 / 突破
如果价格收盘高于最近的阻力水平,并带有可调节的突破缓冲,指标将其解读为看涨突破。 - 卖出 / 跌破
如果价格收盘低于最近的支撑水平,并带有可调节的跌破阈值,指标将其解读为看跌跌破。 - 等待
如果价格保持在支撑和阻力之间,指标表示市场仍处于区间内,尚未发生明确的方向性突破。
这一逻辑帮助交易者避免情绪化决策,并提供了一个更客观的市场结构阅读框架。
为真实图表决策而构建
SR Commander 不仅仅是绘制线条。它旨在帮助交易者理解价格在 这些线上的表现。
除了检测突破和跌破条件外,指标还可以识别:
- 买入反弹信号 当价格测试支撑并带有看涨确认收盘回到支撑之上时
- 卖出拒绝信号 当价格测试阻力并带有看跌确认收盘回到阻力之下时
- 历史突破和跌破标记 以便可以直接在图表上回顾之前的市场反应
- 可选的 历史买卖反应点,供希望研究过去支撑/阻力行为的交易者使用
这使得 SR Commander 不仅适用于实时分析,还适用于图表回顾、模式识别和交易日志记录。
清晰的视觉结构
SR Commander 的优势之一是其简洁性。该指标设计保持视觉清晰,同时传递关键信息。
它可以显示:
- 最近的 支撑 和 阻力 水平
- 可选的 价格标签 显示在线条上
- 一个紧凑的 仪表盘 显示当前市场状况
- 一个大型中央状态信息,如 买入、卖出 或 等待
- 历史符号,表示过去的突破和跌破事件
结果是一个即使在活跃市场条件下也保持可读和高效的图表。
智能过滤逻辑
SR Commander 还包括实用的过滤器以提高信号质量。
例如,指标可以忽略支撑和阻力之间距离过小的情况。当当前区域变得过窄时,市场可能过于压缩或不明确,难以做出有意义的决策。在这种情况下,指标返回 等待 状态,而不是强制发出低质量信号。
这有助于减少误触发,并保持关注更清晰的交易机会。
主要特点
- 自动检测相关的支撑和阻力水平
- 突出显示当前价格附近的可操作水平
- 识别 突破、跌破 和 等待 市场状态
- 可选的 买入反弹 和 卖出拒绝 信号
- 历史突破和跌破的可视化
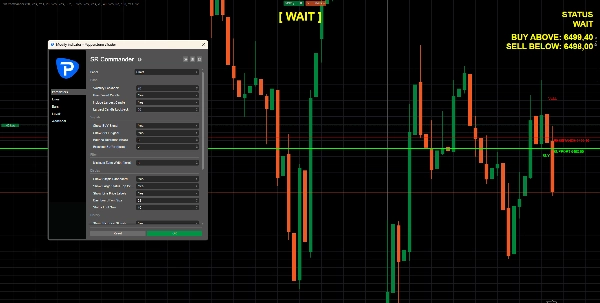
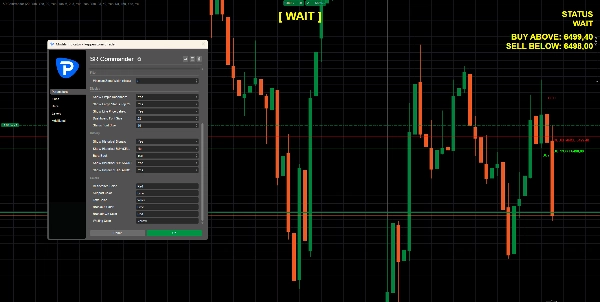
- 可调节的突破缓冲和反弹容差
- 可选使用已收盘蜡烛确认
- 清晰的仪表盘和大型状态显示
- 简单的视觉布局,便于快速读取图表
适用人群
SR Commander 适合依赖价格结构和基于水平决策的交易者,包括:
- 突破交易者
- 价格行为交易者
- 日内交易者
- 波段交易者
- 希望图表结构更清晰的自由裁量交易者
- 寻找支撑和阻力附近快速视觉确认的交易者
无论您交易反转、回测、区间突破还是延续走势,SR Commander 都能帮助您专注于图表上最重要的水平。
为何使用 SR Commander
当太多指标争夺注意力时,市场往往变得混乱。SR Commander 通过技术分析中最重要的概念之一: 支撑与阻力,为交易者提供了一个结构化且易读的市场视图,从而解决了这个问题。
通过将水平检测、波动率感知逻辑、反弹/拒绝识别和突破状态结合在一个干净的工具中,SR Commander 帮助交易者快速回答三个关键问题:
- 价格当前处于何处?
- 市场是在突破、跌破还是仍在区间内?
- 价格在关键水平上是强势反应还是被拒绝?
这创造了更有纪律的工作流程,使交易者能够以更清晰、更少图表噪音的方式做出决策。
重要提示
SR Commander 设计为技术分析的决策支持工具。它不保证交易获胜,应始终与您自己的市场背景、确认方法和风险管理规则一起使用。
摘要
SR Commander identifies breakout and breakdown scenarios when price closes beyond the nearest resistance or support levels, respectively, with adjustable buffers. It also signals buy bounces and sell rejections when price tests and reacts to these levels. Historical breakout and breakdown events are marked on the chart for review and pattern recognition.
The indicator features smart filtering to avoid low-quality signals, such as ignoring zones where support and resistance are too close. Its clean visual layout includes optional price labels, a large status message, and historical reaction points, facilitating fast and structured market analysis.
SR Commander supports traders focusing on price structure and level-based strategies, including breakout, price action, intraday, and swing trading across various markets such as forex, indices, commodities, stocks, and cryptocurrencies. It serves as a decision-support tool to enhance clarity and reduce chart noise in technical analysis.


