
Description
Indice de Momentum Stochastique (SMI) est un oscillateur stochastique affiné conçu pour mesurer le momentum de manière plus fluide qu'un stochastique classique. Cette implémentation cTrader correspond à la formulation couramment utilisée sur TradingView en appliquant un lissage double EMA à la fois à la plage relative et à la plage haut-bas, produisant une courbe de momentum propre et stable qui fonctionne bien dans des conditions de tendance et de range.
Ce qu'il montre
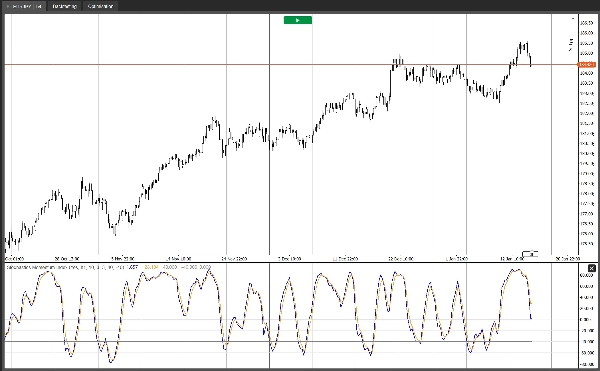
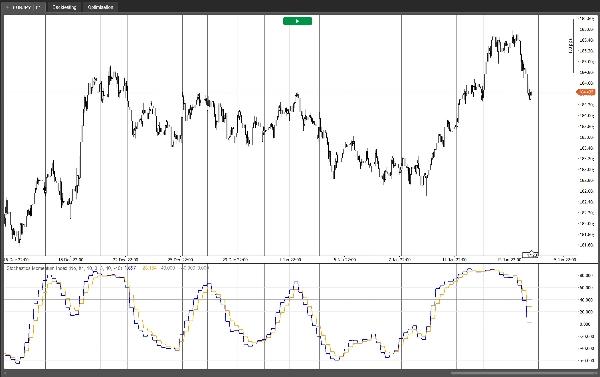
- Le SMI mesure où se situe la clôture par rapport au point médian de la plage haut-bas récente, normalisée et mise à l'échelle.
- Les valeurs ont tendance à osciller entre -100 et +100.
- Les niveaux de référence de surachat/survente (par défaut +40 / -40) aident à identifier les conditions étirées et les extrêmes de momentum.
Tracés
- SMI : la ligne principale de momentum.
- EMA basée sur le SMI : une ligne de signal (EMA du SMI) pour les croisements et la confirmation.
- Niveaux Surachat / Survente / Milieu (0) pour un contexte visuel rapide.
Comment les traders l'utilisent
- Régimes de tendance : Utilisez la ligne 0 comme filtre directionnel (au-dessus de 0 = pression haussière, en dessous de 0 = pression baissière) et tradez les replis via les croisements SMI vs ligne de signal dans la direction de la tendance.
- Régimes de retour à la moyenne : Contrez les extrêmes lorsque le SMI revient de surachat/survente et confirme par un croisement, visant souvent la ligne 0 comme premier objectif de retour à la moyenne.
- Divergences : La divergence de momentum entre le prix et le SMI peut mettre en évidence des oscillations potentiellement affaiblies.
Option multi-échelle temporelle
- Sélectionnez une Échelle Temporelle Source pour calculer le SMI à partir d'une échelle temporelle supérieure tout en l'affichant sur le graphique actuel (idéal pour filtrer le bruit et améliorer la qualité du signal).
- Ou activez Utiliser l'Échelle Temporelle du Graphique pour garder les calculs sur l'échelle temporelle actuelle.
Entrées
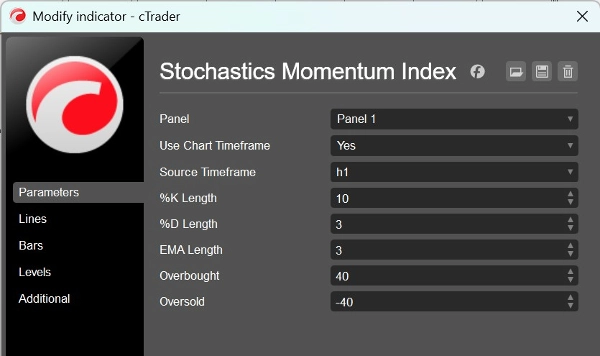
- Longueur %K : fenêtre de retour pour le plus haut / plus bas.
- Longueur %D : longueur de lissage utilisée dans le calcul double-EMA.
- Longueur EMA : longueur de la ligne de signal (EMA du SMI).
- Surachat / Survente : niveaux de référence.
- Utiliser l'Échelle Temporelle du Graphique / Échelle Temporelle Source : calcul optionnel sur une échelle temporelle supérieure.
Cet indicateur est conçu pour être léger, stable et pratique pour les flux de travail de trading réels — que vous tradiez la continuation de tendance, les ranges, ou que vous utilisiez le SMI comme filtre de confirmation dans une stratégie plus large.
Résumé
The indicator plots three key elements: the main SMI momentum line, an EMA-based signal line for crossovers and confirmation, and reference levels for overbought, oversold, and the zero midpoint. Traders use the zero line as a directional filter to identify bullish or bearish pressure and trade pullbacks via SMI and signal line crossovers. It also supports mean-reversion strategies by signaling fades from overbought/oversold conditions and can highlight momentum divergences.
A multi-timeframe option allows calculation of the SMI from a higher timeframe while displaying it on the current chart, helping to filter noise and improve signal quality. User inputs include lookback lengths for %K and %D, signal line EMA length, overbought/oversold levels, and timeframe selection. The indicator is designed for use across various markets including Forex, stocks, commodities, indices, and cryptocurrencies.
Avis clients
5 | 50 % | |
4 | 50 % | |
3 | 0 % | |
2 | 0 % | |
1 | 0 % |


![Logo de "[Hamster-Coder] Bollinger Bands"](https://cdn.ctrader.com/image/webp/21d8e5d6-fb11-4bac-b9ee-cd05c2b76804_30327)
