
RegressionChannelV2
指标
版本 1.0, Jan 2026
Windows 版、Mac 版
5.0
评价:1
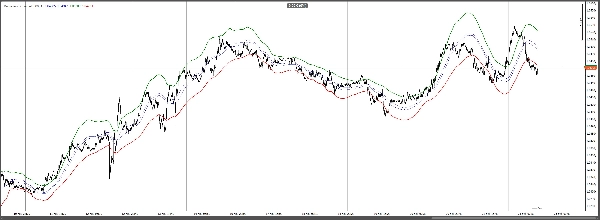
说明
回归通道是一种可视化的趋势和波动性工具,它在价格周围绘制一个平滑的通道。它根据近期的市场行为计算自适应的上下边界,帮助您快速识别主要方向,衡量波动性的扩张/收缩,并识别潜在的过度延伸走势。
用途:
- 确认趋势方向和强度
- 突出显示通道边缘附近的均值回归区域
- 当价格突破边界时识别突破
- 结合现有信号改善入场/出场时机
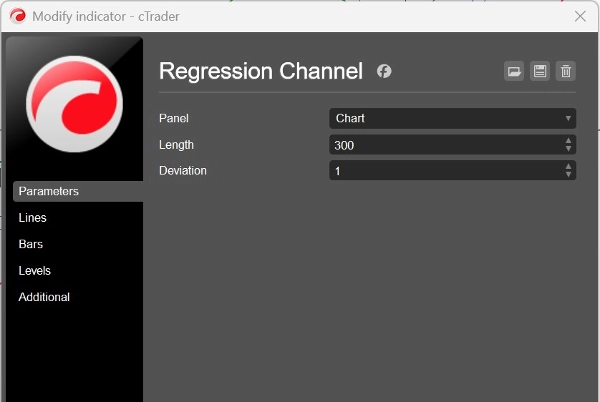
参数:
- 长度:用于通道计算的回溯窗口
- 偏差:控制通道紧密或宽松的带宽乘数
摘要
指标配置
客户评价
5.0
评价:1
5 | 100 % | |
4 | 0 % | |
3 | 0 % | |
2 | 0 % | |
1 | 0 % |
客户评价
January 24, 2026
Messy entries become more obvious, but the market context still matters.
讨论
常见问答
BTCUSD
Forex
Signal
Breakout
Indices
EURUSD
Commodities
GBPUSD
NZDUSD
Prop
Scalping
Crypto
Stocks
XAUUSD
NAS100
USDJPY
cTrader Store 提供的所有产品,包括交易机器人、指标和插件,均由第三方开发者提供,仅供信息参考和技术访问之用。cTrader Store 并非经纪商,不提供投资建议、个人推荐或任何未来业绩保证。
该作者的其他作品


价格
注册日期 31/01/2025
415.05M
交易量
2.69M
盈利点数
4
销售
187
免费安装