
Description
Le Pro Heikin Ashi Visual Overlay est l'outil parfait pour les traders qui souhaitent bénéficier des avantages de lissage de tendance des chandeliers Heikin Ashi tout en conservant leurs graphiques standard en chandeliers ou en barres actifs.
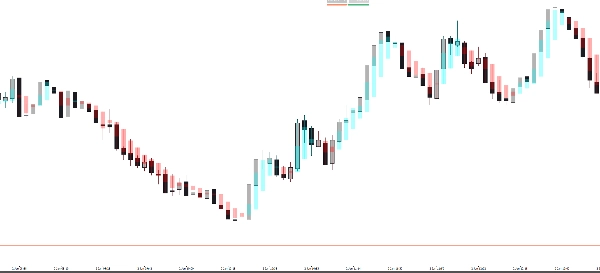
Les graphiques Heikin Ashi traditionnels vous obligent à changer complètement le type de graphique, ce qui rend difficile la visualisation précise de l'action des prix. Cet indicateur résout ce problème en dessinant les chandeliers Heikin Ashi comme une superposition semi-transparente, vous permettant de repérer instantanément les retournements de tendance et le momentum du marché sans perdre de vue le prix réel.
Pourquoi utiliser cette superposition ?
- 💎 Réduction du bruit : Heikin Ashi filtre le bruit du marché, facilitant ainsi le maintien des positions gagnantes.
- 🕯️ Vue double graphique : Conservez vos chandeliers standards pour l'action des prix et les motifs tout en utilisant la superposition HA pour la direction de la tendance.
- 🎨 Entièrement personnalisable : Ajustez l'opacité et les couleurs pour correspondre à votre espace de travail (mode sombre ou clair).
- 🚀 Identification instantanée de la tendance : Les zones bleues (haussières) et rouges (baissières) vous aident à éviter de trader contre le momentum.
Caractéristiques clés :
- Transparence intelligente : Réglez l'opacité pour que la superposition ne masque pas votre action principale des prix.
- Alignement parfait : Calculé en temps réel pour correspondre aux valeurs Heikin Ashi du timeframe actuel.
- Design professionnel : Visuels épurés qui ne surchargent pas votre graphique.
- Universel : Fonctionne sur tous les timeframes (M1 à Mensuel) et tous les actifs (Forex, Actions, Crypto, Indices).
Comment l'utiliser :
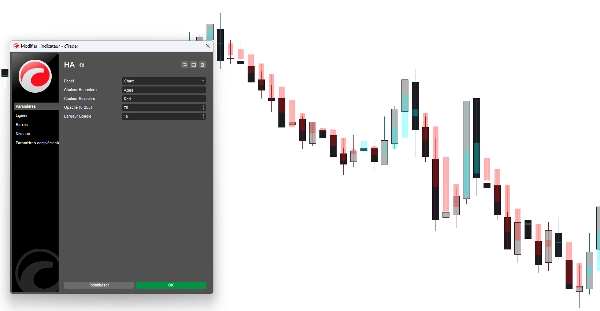
- Appliquez l'indicateur à votre graphique.
- Ajustez l'opacité et la largeur du corps dans les paramètres selon vos préférences.
- Utilisez les chandeliers HA pour confirmer la force de la tendance :
-
- De longues mèches dans la direction de la tendance = Momentum fort.
- Petits corps avec des mèches des deux côtés = Reversal potentiel.
Paramètres :
- Couleur haussière : Couleur personnalisée pour les chandeliers HA à la hausse.
- Couleur baissière : Couleur personnalisée pour les chandeliers HA à la baisse.
- Opacité (0-255) : Contrôlez à quel point les chandeliers apparaissent "fantomatiques" ou solides.
- Largeur des chandeliers : Ajustez l'épaisseur des chandeliers HA pour qu'elle corresponde parfaitement à votre niveau de zoom.
Résumé
Key features include noise reduction to filter market fluctuations, customizable opacity and colors for integration with different chart backgrounds, and real-time alignment with the current timeframe’s Heikin Ashi calculations. The overlay uses blue and red zones to indicate bullish and bearish trends, aiding in immediate trend identification. It supports all timeframes from one minute to monthly and is compatible with various asset classes including Forex, stocks, cryptocurrencies, commodities, and indices.
Users can adjust candle width and opacity to suit their chart zoom level and visual preferences. The indicator facilitates dual-chart viewing, enabling simultaneous analysis of precise price patterns and smoothed trend momentum. It is designed with clean visuals to avoid chart clutter and supports professional trading environments.
Avis clients
5 | 0 % | |
4 | 100 % | |
3 | 0 % | |
2 | 0 % | |
1 | 0 % |


