
FVG & Imbalance Detector
Indicateur
2 achats
Version 1.0, Jan 2026
Windows, Mac
4.0
Avis : 2
Description
Dans le monde des Smart Money Concepts (SMC) et ICT, les déséquilibres de prix sont les "empreintes digitales" des grands acteurs institutionnels. Lorsque le marché bouge trop vite, il laisse derrière lui un Fair Value Gap (FVG)—une zone d'inefficacité que le prix revient presque toujours "combler" ou retester.
Le FVG & Imbalance Detector pour cTrader est un outil performant conçu pour détecter automatiquement ces inefficacités. Plus besoin de dessiner manuellement—obtenez des zones claires et exploitables directement sur votre graphique.
Pourquoi cet indicateur est indispensable :
- 🚀 Repérer les mouvements institutionnels : Voyez où les grandes banques et les fonds spéculatifs sont entrés sur le marché avec un volume massif.
- 🎯 Zones à haute probabilité : Utilisez les déséquilibres identifiés comme cibles magnétiques pour les prises de bénéfices ou comme "Zones Dorées" pour des entrées précises.
- 📈 Visualisation claire : Des superpositions rectangulaires de haute qualité qui rendent l'analyse de tendance facile.
- 🔧 Entièrement flexible : Contrairement aux indicateurs basiques, cette version vous permet d'étendre les zones dans le futur ou d'ajuster leurs points de départ pour correspondre à votre stratégie spécifique.
Fonctionnalités exclusives :
- Logique de détection intelligente : Un algorithme avancé identifie avec une précision pixel parfaite les inefficacités en haut (baissières) et en bas (haussières).
- Décalages bidirectionnels : Les paramètres exclusifs de décalage "Start" et "End" vous permettent de projeter les zones vers l'avant ou vers l'arrière pour voir comment les gaps historiques s'alignent avec l'action actuelle des prix.
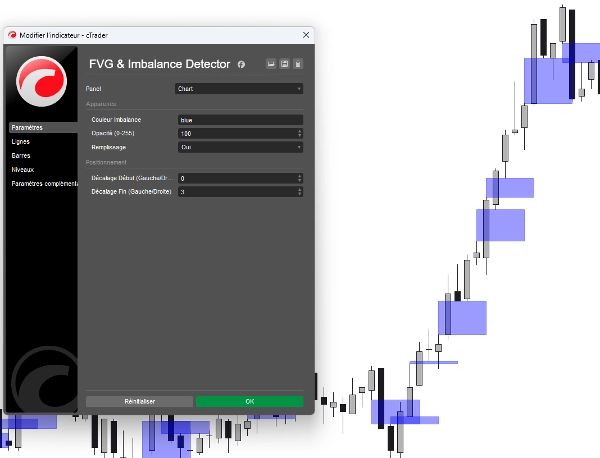
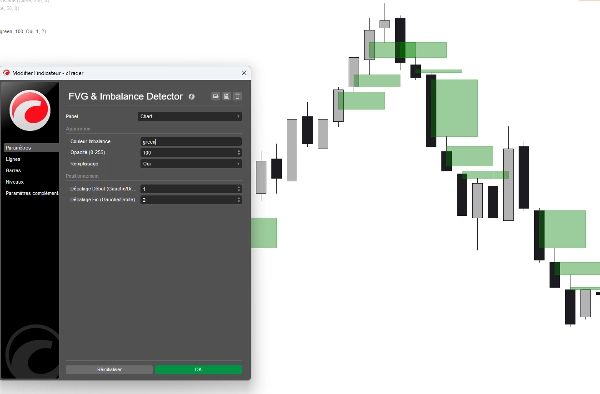
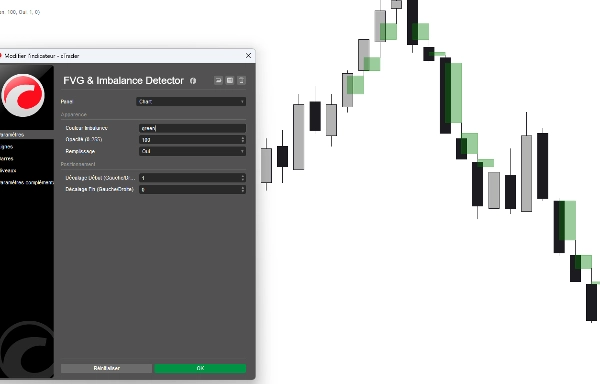
- Interface couleur professionnelle : Choisissez votre style préféré via un menu déroulant clair (Jaune, Aqua, Rouge, etc.)—plus besoin de taper des codes hexadécimaux !
- Contrôle de l'opacité : Ajustez la transparence pour que les zones ne surchargent pas votre vue de l'action des prix.
- Performance optimisée : Code léger qui ne ralentira pas votre plateforme cTrader, même sur plusieurs graphiques.
Comment l'utiliser :
- Identifier le gap : L'indicateur dessine un encadré là où un déséquilibre se produit entre le plus haut de la première bougie et le plus bas de la troisième.
- Attendre le retest : Surveillez le retour du prix vers ces encadrés.
- Exécuter : Recherchez des configurations de rejet dans la zone FVG pour des entrées à faible risque et haute récompense.
Résumé
Résumé IA
The FVG & Imbalance Detector is an indicator for the cTrader platform designed to identify Fair Value Gaps (FVG) and price imbalances, key concepts in Smart Money Concepts (SMC) and Institutional Cycle Trading (ICT). These gaps represent zones of market inefficiency created by rapid price moves, often reflecting institutional activity. The indicator automatically detects and highlights these zones on the chart with clear rectangular overlays, eliminating the need for manual drawing.
Key features include detection of both bullish (bottom) and bearish (top) imbalances with high precision, customizable zone extensions via start and end offset parameters, and adjustable opacity and color settings for clear visualization. The tool is optimized for performance to avoid slowing down the platform, even when applied to multiple charts.
Traders can use the indicator to spot where large institutional players have entered the market, identify high-probability zones for entries or take-profits, and monitor price retests of these inefficiency zones for potential trade execution. The indicator supports analysis across various markets including Forex, Indices, Commodities, and Crypto.
Profil de l'indicateur
Avis clients
4.0
Avis : 2
5 | 0 % | |
4 | 100 % | |
3 | 0 % | |
2 | 0 % | |
1 | 0 % |
Avis clients
January 18, 2026
tested small first and that felt like the right move, and account protection still comes first.
January 14, 2026
Discussion
Questions fréquentes
Forex
Indices
Commodities
Crypto
AI
Les produits disponibles sur cTrader Store, notamment les bots de trading, les indicateurs et les plug-ins, sont fournis par des développeurs tiers et mis à disposition à titre informatif et à des fins d'accès technique uniquement. cTrader Store n'est pas un courtier et ne fournit aucun conseil en investissement, aucune recommandation personnelle ni aucune garantie quant aux performances futures.
Plus de cet auteur


![Logo de "[Stellar Strategies] Market Session Ultimate"](https://cdn.ctrader.com/image/webp/61ffd537-0125-4246-9e72-42eca1791d64_28232)
Prix
Depuis le 27/10/2025
10
Ventes