
说明
“逆向工程”概念
该指标的主要创新在于其 逆向工程 算法。通常,随机振荡器将价格数据转换为介于0到100之间的数字。该指标则相反:它采用振荡器的数学水平并 将其重新投射回价格刻度。
这使交易者能够将数学动量直接转换为 具体的价格水平(美元或点数),直接显示在图表上。
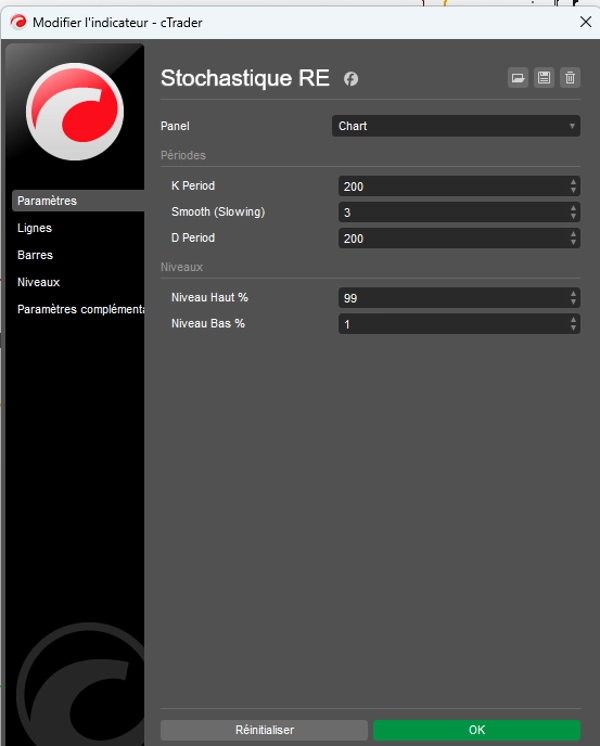
定义边界:上限(99%)和下限(1%)
与经典设置(80/20)不同,该指标默认设置为 1% 和 99%。此配置有其特定目的: 它定义了价格的物理极限。
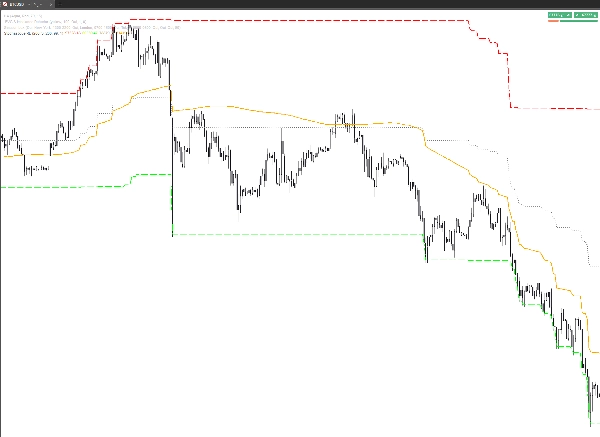
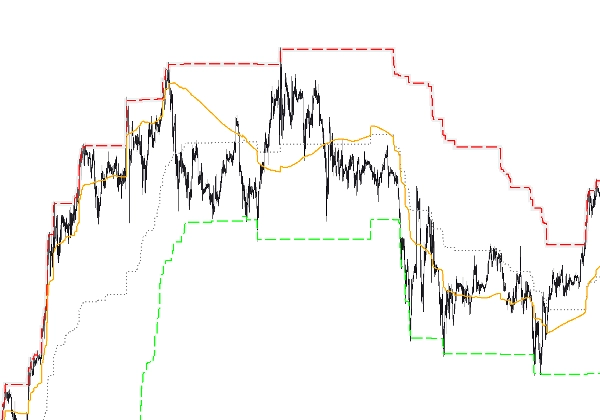
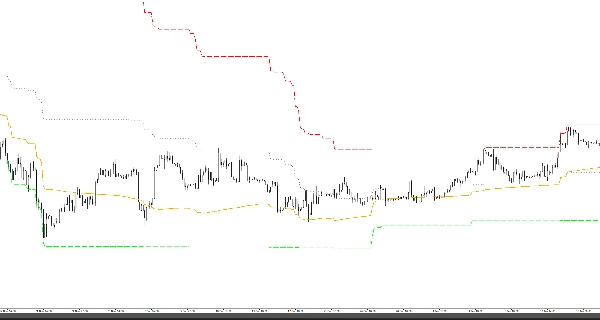
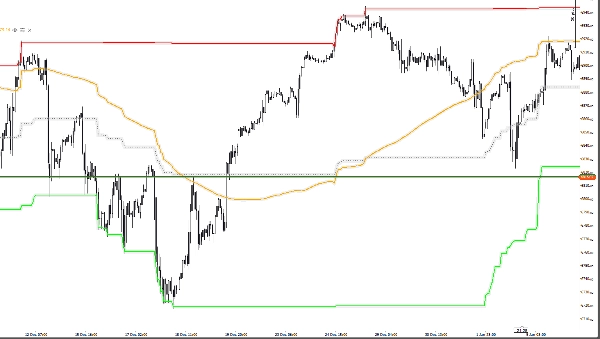
- 99%水平(价格上限): 它定义了市场在给定周期内达到其运动幅度99%耗尽之前的最高价格。它是价格的“边界”。
- 1%水平(价格下限): 它定义了当前周期的最低价格,即最终支撑位。它是价格相对于其近期历史向下能力耗尽99%的水平。
为什么它“定义价格”?
得益于该系统, 橙色信号%D 线不再只是一个在真空中移动的曲线。
- 价格定位: 它显示了由动量加权的“公平价格”的确切位置。
- 范围映射: 它将图表转变为一张地图,您可以看到当前价格“值不值”其潜力的1%或99%。
- 具体目标: 如果橙线向上移动,它不仅仅是想达到“80”;它是想达到由红线(99%)显示的 精确价格。
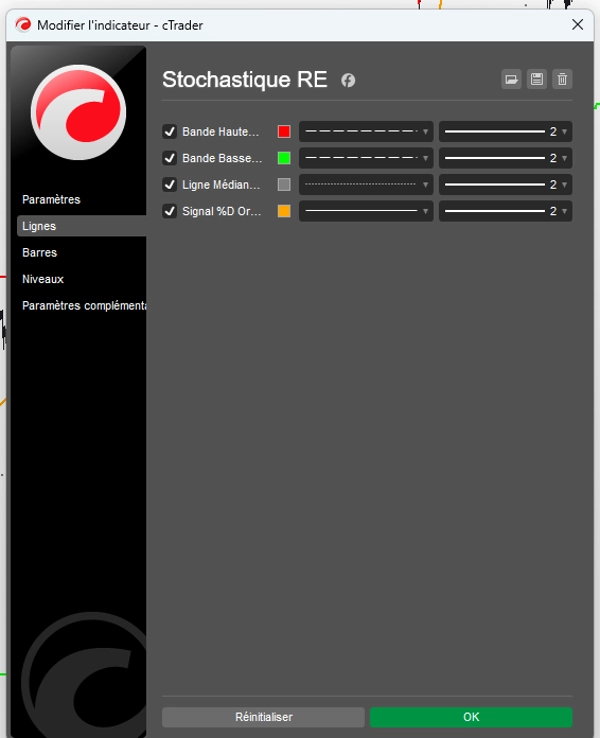
线条功能(线条标签)
一切均可自定义以实现即时视觉读取:
- 上轨(99%): 理论价格上限。
- 下轨(1%): 理论价格下限。
- 中线(50%): 中心枢轴点,均衡区。
- 橙色信号%D: 在下限和上限之间导航以定义市场方向的动态光标。
交易者总结
该指标不仅告诉您市场“超买”;它向您展示了 市场在何种确切价格 变得物理上过于昂贵(99%)或过于便宜(1%)。它是一种精密工具,将数学带回订单簿的现实。
摘要
AI 摘要
Stochastique RE is an indicator that applies a reverse engineering algorithm to the stochastic oscillator concept. Instead of converting price data into a stochastic value between 0 and 100, it projects stochastic levels (1% to 99%) back onto the price scale. This approach defines concrete market boundaries by identifying a price ceiling (99%) and a price floor (1%), representing the physical limits of price movement over a given period.
The indicator displays these boundaries directly on the price chart, allowing traders to see exact price levels where the market is considered overbought or oversold. Key features include customizable lines for the upper band (99%), lower band (1%), mid line (50%), and an orange signal %D line that dynamically indicates market direction between these boundaries.
By translating momentum into precise price targets, Stochastique RE helps traders localize fair price zones, map price ranges, and identify concrete price targets rather than abstract oscillator values. It supports various markets including Forex, stocks, commodities, indices, and cryptocurrencies, with symbol tags such as BTCUSD, EURUSD, GBPUSD, XAUUSD, NAS100, and USDJPY.
指标配置
客户评价
4.6
评价:3
5 | 67 % | |
4 | 33 % | |
3 | 0 % | |
2 | 0 % | |
1 | 0 % |
客户评价
February 28, 2026
helps more when the trader avoids forced trades. Half size is enough at the start.
February 18, 2026
Solid enough as a backup opinion. Two sessions say more than one clean chart.
讨论
常见问答
BTCUSD
Forex
Breakout
Indices
EURUSD
Commodities
GBPUSD
NZDUSD
Crypto
Stocks
XAUUSD
NAS100
USDJPY
cTrader Store 提供的所有产品,包括交易机器人、指标和插件,均由第三方开发者提供,仅供信息参考和技术访问之用。cTrader Store 并非经纪商,不提供投资建议、个人推荐或任何未来业绩保证。
该作者的其他作品


价格
注册日期 27/10/2025
9
销售