
Higher TimeFrame Candle Tracker
Indicador
1 compras
Versión 1.0, Oct 2025
Windows, Mac
Descripción
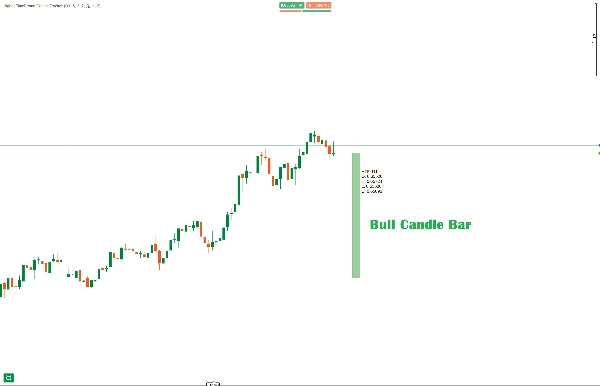
El rastreador de velas de marco temporal superior se utiliza para obtener una visión de cómo es la vela del marco temporal superior seleccionado.
Características clave:
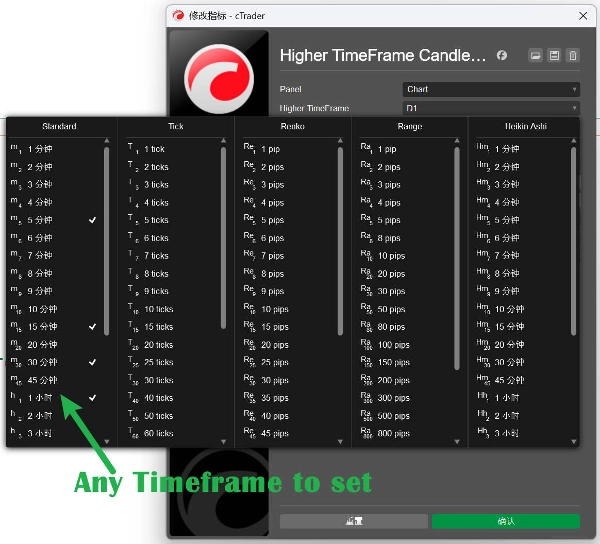
- Selección de marco temporal personalizable - Elija cualquier marco temporal superior (Diario, Semanal, Mensual, etc.)
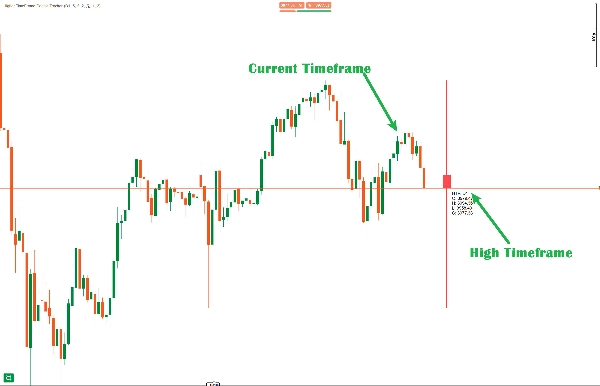
- Visualización visual de la vela - La vela HTF actual se representa con mechas y cuerpo adecuados, desplazada de la acción del precio actual
Configuraciones ajustables:
- Desplazamiento: Distancia en barras desde el precio actual (predeterminado: 5)
- Ancho de la vela: Grosor del cuerpo de la vela (1-10, predeterminado: 3)
- Ancho de la mecha: Grosor de las líneas de la mecha (1-5, predeterminado: 1)
- Colores: Colores personalizables para alcista (verde) y bajista (rojo)
Soporte de marco temporal:
- Minute, Minute2, Minute3, Minute4, Minute5
- Minute10, Minute15, Minute30, Minute45
- Hour, Hour4, Hour12
- Daily, Day2, Day3
- Weekly, Monthly
Tabla de información - Muestra datos en tiempo real de la vela HTF: valores de Apertura, Máximo, Mínimo, Cierre.
中文说明:
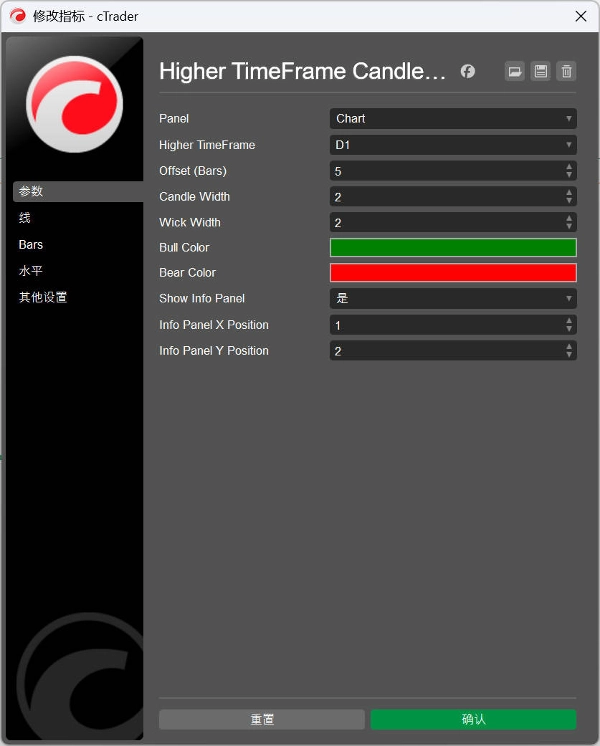
可自定义参数:
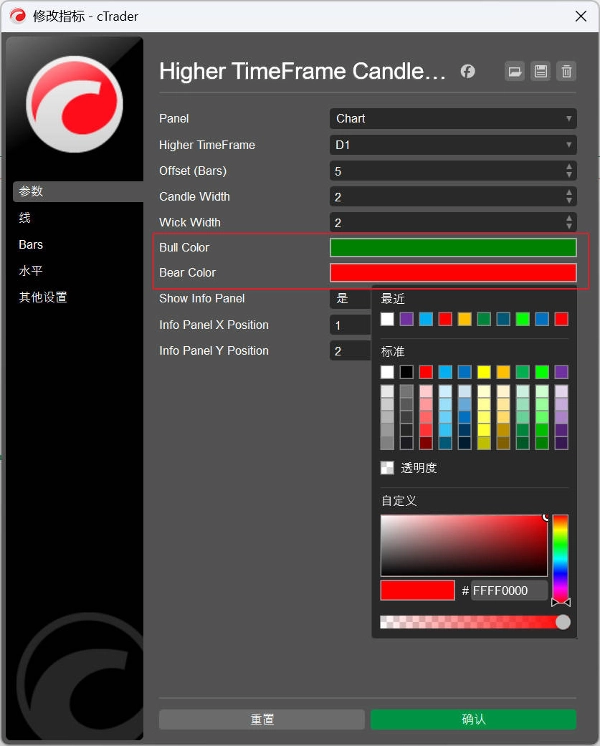
- Higher TimeFrame(高时间框架) - 选择要跟踪的时间框架(默认:Daily)
- Offset(偏移量) - K线距离当前价格的位置(默认:5根K线)
- Candle Width(K线宽度) - K线实体的宽度(1-10,默认:3)
- Wick Width(影线宽度) - 影线的宽度(1-5,默认:2)
- Bull Color(看涨颜色) - 看涨K线颜色(默认:Green)
- Bear Color(看跌颜色) - 看跌K线颜色(默认:Red)
- Show Info Panel(显示信息面板) - 是否显示HTF数据面板(默认:true)
核心特性:
- 实时HTF K线显示 - 在图表上绘制当前高时间框架K线
- 完整的K线结构 - 包含实体、上影线和下影线
- 颜色区分 - 自动根据涨跌使用不同颜色
- 信息面板 - 显示Open、High、Low、Close和方向指示
- 自适应填充 - 看涨K线半透明,看跌K线较深
支持的时间框架:
- Minute, Minute2, Minute3, Minute4, Minute5
- Minute10, Minute15, Minute30, Minute45
- Hour, Hour4, Hour12
- Daily, Day2, Day3
- Weekly, Monthly
Resumen
Perfil del indicador
Valoraciones de clientes
0.0
Valoraciones: 0
Valoraciones de clientes
Este producto todavía no se ha valorado. ¿Ya lo ha probado? Sea el primero en informar a otros.
Conversación
Preguntas frecuentes
Prop
Forex
Breakout
Indices
Commodities
Crypto
Stocks
Los productos disponibles a través de cTrader Store, incluidos bots, indicadores y plugins para operar, son proporcionados por desarrolladores de terceros y están disponibles únicamente con fines informativos y de acceso técnico. cTrader Store no es un bróker, por lo que no proporciona asesoramiento de inversión, recomendaciones personales ni ninguna garantía de rentabilidad futura.


Precio
Desde 30/09/2024
44
Ventas