
Descripción
Visualizador de Soporte Institucional y Resistencia
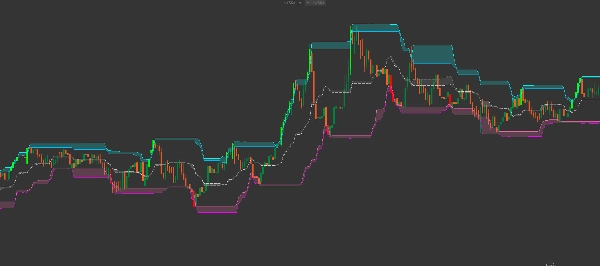
El Smart Donchian Cloud Reversal es un canal de volatilidad de próxima generación diseñado para identificar zonas de reversión de alta probabilidad. A diferencia de los Canales Donchian estándar que solo rastrean los máximos más altos y los mínimos más bajos, este indicador analiza la relación entre las mechas de las velas y los cuerpos de las velas para trazar "Nubes de Presión".
Estas nubes actúan como zonas dinámicas de Oferta y Demanda, mostrándote exactamente dónde es probable que el mercado se detenga o revierta.
Arquitectura Avanzada de Múltiples Nubes
Este indicador cuenta con un sistema sofisticado de 3 capas de nubes:
-
- La Nube de Resistencia (Cian/Azul): Ubicada en la parte superior, visualiza el espacio entre la mecha más alta y el cuerpo de vela más alto. Esta es la "Zona de Venta".
- La Nube de Equilibrio (Gris/Plateado): Una cinta central que rastrea el equilibrio del mercado. Representa el punto medio de valor justo entre mechas y cuerpos.
- La Nube de Soporte (Rosa/Magenta): Ubicada en la parte inferior, visualiza el espacio entre la mecha más baja y el cuerpo de vela más bajo. Esta es la "Zona de Compra".
Características Clave para el Trading
-
- Filtro de Volatilidad ATR: Incluye un multiplicador ATR (Rango Verdadero Promedio) incorporado para desplazar ligeramente las bandas externas, filtrando el ruido del mercado y las "cacerías de stops".
- Pintura Inteligente de Velas: El indicador resalta automáticamente el impulso de ruptura:
- Velas LIMA: El precio ha cerrado por encima de la Nube de Resistencia Superior (Ruptura Alcista).
- Velas ROJAS: El precio ha cerrado por debajo de la Nube de Soporte Inferior (Ruptura Bajista).
- Lógica Mecha vs. Cuerpo: Al observar el grosor de la "nube", puedes medir la volatilidad. Una nube gruesa significa mechas largas (alta rechazo/indecisión), mientras que una nube delgada significa una acción de precio fuerte y decisiva.
Cómo Operar con las Nubes Donchian Inteligentes
1. La Reversión a la Media (Scalping) » Busca que el precio entre en la Nube de Resistencia sin cerrar por encima de ella. Esto a menudo indica un "falso rompimiento", señalando una entrada corta de alta probabilidad de regreso hacia la Línea Media.
2. La Ruptura de Tendencia » Cuando una vela se vuelve Lima (cerrando por encima del filtro de mecha superior), señala que los toros han despejado la zona de resistencia. Esta es una señal poderosa para estrategias de seguimiento de tendencia.
3. El Rebote en Soporte »Observa la Nube de Soporte (Rosa). Cuando el precio toca esta zona durante una corrección en una tendencia alcista, representa un área de "Compra de Valor" donde los compradores institucionales suelen intervenir.
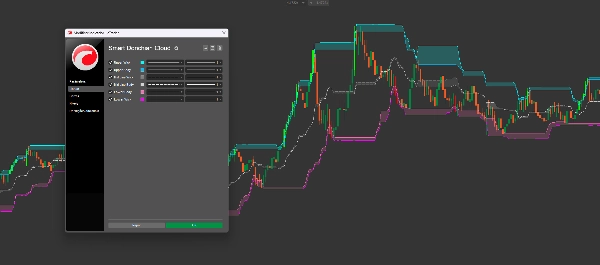
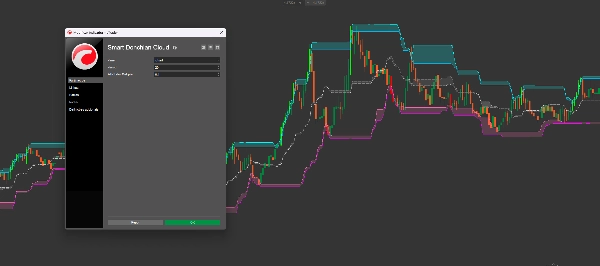
Parámetros Técnicos
-
- Periodo: El período de retroceso para calcular máximos y mínimos (Predeterminado: 20).
- Multiplicador del Filtro ATR: Ajusta el "relleno" alrededor de los extremos para evitar quedar atrapado en picos menores.
- Colores Totalmente Personalizables: Adapta las nubes Superior, Media e Inferior para que se ajusten a tu plantilla de gráfico personal.
Por Qué Esta Herramienta es Esencial
La mayoría de los traders fracasan porque tratan el Soporte y la Resistencia como líneas únicas. En realidad, son Zonas. El Smart Donchian Cloud Reversal mapea estas zonas matemáticamente, dándote una imagen más clara de la estructura del mercado que cualquier indicador de canal tradicional.
Resumen
Valoraciones de clientes
5 | 100 % | |
4 | 0 % | |
3 | 0 % | |
2 | 0 % | |
1 | 0 % |


