Description
Index Hunter : Aperçu
Index Hunter est un indicateur technique spécialisé et un système d’aide à la décision conçu principalement pour les indices à forte volatilité comme US30 (Dow Jones) et NAS100 (Nasdaq). Contrairement aux indicateurs standards qui montrent uniquement les données passées, Index Hunter se concentre sur « Prédiction Vectorielle » — tentant de projeter où le prix est susceptible d’être dans 4 chandeliers dans le futur en se basant sur la vitesse actuelle (pente) à travers plusieurs périodes.
1. Mécanismes de Base (Comment ça Fonctionne)
A. Le Moteur de Prévision "Vector"
C’est le cœur de l’outil. Il ne regarde pas seulement le prix actuel ; il calcule le taux de changement (Pente) sur les périodes M5, M15 et H1 pour tracer un « Chemin Futur » sur votre graphique.
- Mécanique : Il calcule une moyenne pondérée de l’élan provenant de différentes périodes pour projeter 4 points (P1, P2, P3, P4) dans le futur.
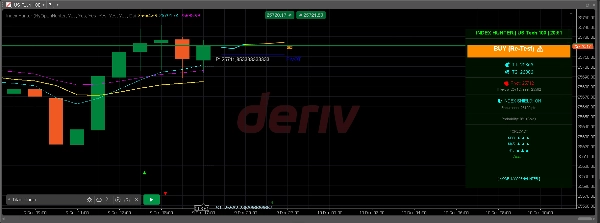
- Visuel : Vous voyez un chemin coloré (Cyan -> Jaune -> Orange) s’étendant à droite du prix, visualisant l’inertie du marché.
- Chemin Fantôme : Il se souvient aussi de la prédiction précédente (Chemin Fantôme) pour que vous puissiez voir si le marché respecte les projections passées de l’algorithme (un « contrôle de réalité »).
B. Système Visuel Multi-Couches
Il superpose automatiquement les niveaux institutionnels critiques :
- Points Pivot (Flexibles) : Calcule automatiquement les niveaux Pivot, R1/S1, et R2/S2 basés sur une période sélectionnable (H12, Quotidien, Jour2, ou Jour3).
- Niveaux Psychologiques : Trace des « Lignes Psych » à chaque intervalle de 100 points (ex. 34000, 34100), qui agissent souvent comme des zones magnétiques pour les indices.
- Haut/Bas Quotidien : Marque la fourchette de la veille pour montrer les zones de cassure ou de rejet.
- Fractales : Identifie les sommets et creux locaux avec des flèches (▲ ▼) pour un placement précis des entrées/stop-loss.
C. Logique de "Confiance" & Faisabilité
L’outil ne donne pas seulement un signal ; il l’évalue.
- Calcul : Il mesure la distance jusqu’à votre objectif de profit et la compare à l’énergie actuelle du marché (ATR - Average True Range).
- Résultat :
-
- CHAUD (>80%) : Forte dynamique + distance cible raisonnable.
- TIÈDE (50-80%) : Configuration modérée.
- FROID (<50%) : Le marché suppose une faible probabilité d’atteindre la cible (ex. la cible est trop éloignée pour la volatilité actuelle).
D. Mécanismes de "Bouclier" du Compte
Il inclut un gestionnaire de risque passif sur le panneau :
- Métrique d’Endurance : Calcule combien de "points" le marché peut bouger contre vous avant que votre compte soit en danger, basé sur votre solde et la taille minimale de lot.
- Statut : Affiche "🛡️ BOUCLIER D’INDICE : ACTIVÉ" si votre compte est sûr par rapport à la volatilité actuelle (ATR), ou "⚠️ MARGE FAIBLE" si la volatilité est trop élevée pour votre solde.
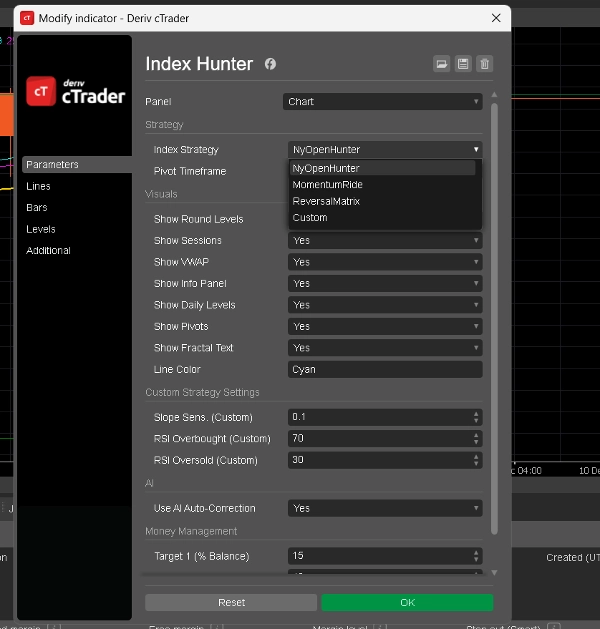
2. Modes Disponibles (Stratégies)
Vous pouvez basculer entre ces modes dans les paramètres de l’indicateur (
Index Strategy
paramètre). Chaque mode change la façon dont l’IA interprète le marché.
1. Mode : NyOpenHunter (Scalpeur de New York)
- Idéal Pour : Les 2-3 premières heures chaotiques de l’ouverture du marché US.
- Logique :
-
- Heure Active : 13:00 - 17:00 UTC (approx).
- Déclencheur : Il recherche une pente M5 supérieure à 0.1 (ou inférieure à -0.1).
- Philosophie : « Attraper l’explosion. » Il attend la poussée initiale de volume à la cloche de NY et signale de surfer cette vague spécifique.
- Sentiment du Panneau : Affiche "NY OPEN BUY 🚀" ou "NY OPEN SELL 🔻".
2. Mode : MomentumRide (Suiveur de Tendance)
- Idéal Pour : Tendances fortes et soutenues en dehors de l’ouverture.
- Logique :
-
- Déclencheur : Nécessite une pente M5 plus forte (> 0.2) que le mode NY.
- Philosophie : « Ne pas se faire hacher. » Il ignore les mouvements faibles et ne signale que lorsque le marché bouge avec une conviction significative.
- Sentiment du Panneau : Affiche "MOMENTUM UP 🟢" ou "MOMENTUM DOWN 🔴".
3. Mode : ReversalMatrix (Contre-Tendance)
- Idéal Pour : Marchés en range ou pour attraper les sommets/creux.
- Logique :
-
- Déclencheur : Utilise le RSI (Relative Strength Index).
-
- Signal de Vente : RSI > 75 (Suracheté).
- Signal d’Achat : RSI < 25 (Survendu).
- Philosophie : « Atténuer les extrêmes. » Il identifie quand l’élastique est trop tendu et est susceptible de se relâcher.
- Sentiment du Panneau : « SURACHETÉ (VENTE BIENTÔT) » ou « SURVENDU (ACHAT BIENTÔT) ».
4. Mode : Personnalisé (Défini par l’Utilisateur)
- Idéal Pour : Utilisateurs avancés souhaitant ajuster le bot.
- Logique : Vous permet de définir vos propres seuils pour Sensibilité de la Pente et niveaux RSI dans les paramètres.
-
- Exemple : Vous pouvez créer une stratégie hybride qui n’achète que si la pente > 0.05 ET RSI < 40.
3. Le "Panneau d’Info" (Affichage Tête Haute)
Le panneau visuel sur le côté droit du graphique consolide toutes ces données :
- En-tête : Affiche le mode actuel et le symbole.
- Préférence : Le biais principal de l’IA (ex. « ACHAT 34150 ▲ »).
- Objectifs (T1, T2) : Objectifs de profit dynamiques calculés selon vos paramètres de pourcentage de compte et la volatilité.
- Prévision : Une analyse séquentielle des tendances M30, M45, et H1 (ex. « M30 : ▲ ▲ ▲ » signifie un alignement d’achat fort).
- Probabilité : Le score de confiance de l’IA (Chaud/Tiède/Froid).
Résumé
Key features include an automatic overlay of institutional levels such as pivot points (with selectable timeframes), psychological price levels at 100-point intervals, previous day’s high/low, and fractals marking local tops and bottoms. It incorporates a confidence grading system (Hot, Warm, Cold) based on momentum strength and volatility relative to profit target distance.
Index Hunter includes a risk management "Shield" that assesses account safety by calculating potential adverse market moves against account balance and lot size, displaying status alerts accordingly.
The indicator offers four operational modes: NyOpenHunter (New York market open scalping), MomentumRide (trend following), ReversalMatrix (counter-trend using RSI), and a Custom mode for user-defined slope and RSI thresholds. A comprehensive info panel consolidates mode, bias, dynamic targets, trend forecasts, and confidence scores for decision support.
Avis clients
5 | 67 % | |
4 | 33 % | |
3 | 0 % | |
2 | 0 % | |
1 | 0 % |