説明
概要
Waddah Attar Explosion(WAE)インジケーターは、Ahmad Waddah Attarによって作成され、2007年にトレーディングコミュニティに紹介されました。これはMACDのモメンタム測定とボリンジャーバンドのボラティリティ分析を組み合わせて、「価格爆発」瞬間、つまり価格がレンジから強い方向性の動きに移行する期間を特定します。
このインジケーターは2つの質問に答えます:
- モメンタムは高まっているか?(MACDの変化率で測定)
- ボラティリティは拡大しているか?(ボリンジャーバンドの幅で測定)
両方の条件がノイズフィルター(デッドゾーン)を超えて一致すると、潜在的な爆発的な動きを示します。
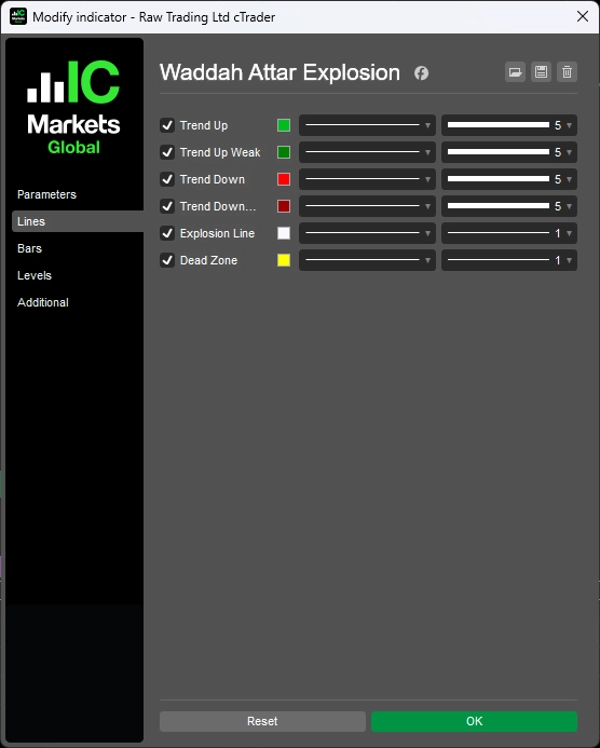
構成要素
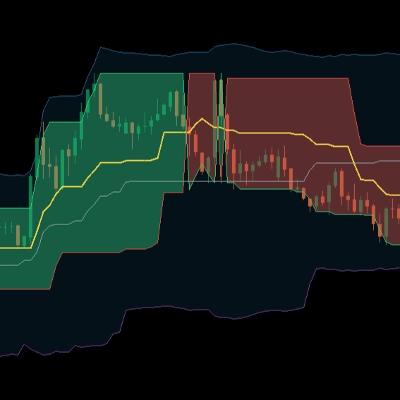
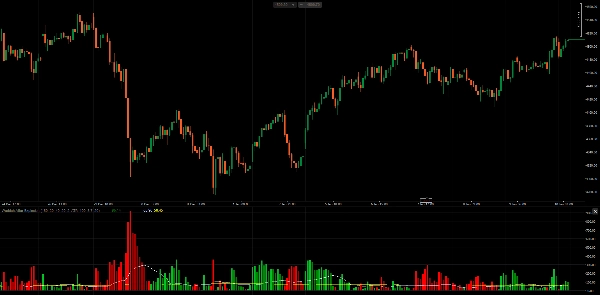
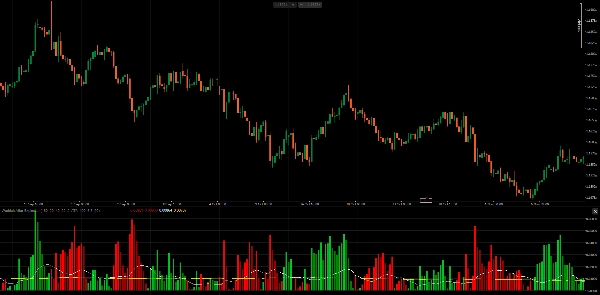
1. トレンドヒストグラム(緑/赤) MACDラインの変化率を感度係数で乗じて表示します。
- 計算式:
(MACD_current - MACD_previous) × Sensitivity - 緑のバー: 強気のモメンタム(MACDが上昇加速)
- 赤のバー: 弱気のモメンタム(MACDが下降加速)
- 明るい色: 前のバーと比べてモメンタムが増加
- 暗い色: 前のバーと比べてモメンタムが減少
2. 爆発ライン(白) ボリンジャーバンドの幅を表し、ボラティリティの拡大または収縮を示します。
- 計算式:
BB_Upper - BB_Lower - 上昇中: ボラティリティ拡大中(潜在的なブレイクアウト)
- 下降中: ボラティリティ収縮中(レンジ相場)
3. デッドゾーン(黄色) 市場ノイズによる弱いシグナルを除去するための閾値フィルター。
- ATRベース: 現在の市場ボラティリティに適応
- 固定ピップス: 静的な閾値値
Ahmad Waddah Attarの使い方
原著者によると:
買いエントリールール すべての条件を満たす必要があります:
- 緑のヒストグラムが上昇している
- 緑のヒストグラムが爆発ラインの上にある
- 爆発ラインが上昇している
- 緑のヒストグラムと爆発ラインの両方がデッドゾーンの上にある
売りエントリールール すべての条件を満たす必要があります:
- 赤のヒストグラムが上昇している
- 赤のヒストグラムが爆発ラインの上にある
- 爆発ラインが上昇している
- 赤のヒストグラムと爆発ラインの両方がデッドゾーンの上にある
エグジットルール
- 緑のヒストグラムが爆発ラインを下回ったらロングを終了
- 赤のヒストグラムが爆発ラインを下回ったらショートを終了
重要な洞察 爆発ラインの角度が重要です。爆発ラインが上向きでヒストグラムがそれを上回ると、ボラティリティが積極的に増加していることを確認でき、「爆発」は偽シグナルではありません。
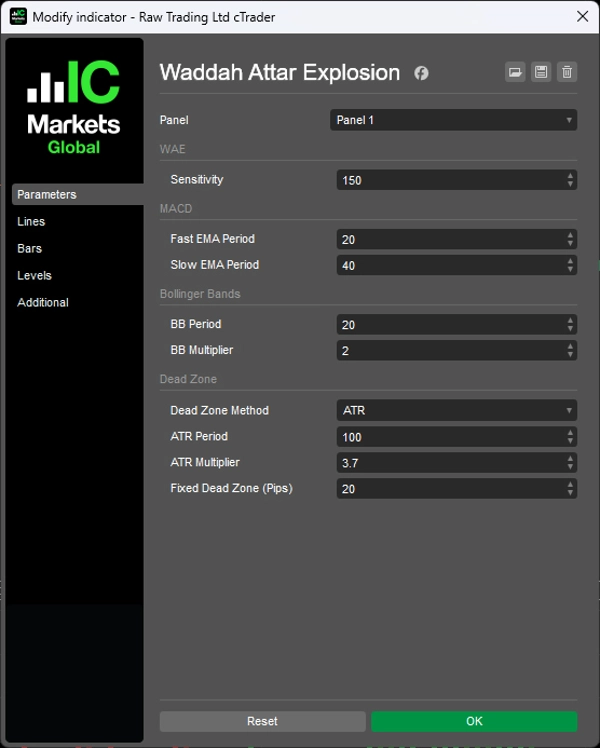
パラメーター
1. 感度
- 感度(150):MACD変化率の乗数
2. MACD
- 高速EMA期間(20):MACD計算用の高速移動平均
- 低速EMA期間(40):MACD計算用の低速移動平均
3. ボリンジャーバンド
- BB期間(20):ボリンジャーバンドの参照期間
- BB乗数(2.0):標準偏差の乗数
4. デッドゾーン
- デッドゾーン方式(ATR):ATRベースか固定ピップスの選択
- ATR期間(100):ATR計算の期間
- ATR乗数(3.7):デッドゾーン用にATRに適用される乗数
- 固定デッドゾーン(20):固定方式使用時のピップス単位のデッドゾーン値
注意事項
- このインジケーターはすべての時間軸で機能します。原著者はH1とM30を推奨しています。
- ATRベースのデッドゾーンは、異なる銘柄や市場状況に適応するため推奨されます。
- 感度パラメーターは時間軸や銘柄のボラティリティに応じて調整が必要な場合があります。
- このインジケーターはモメンタムとボラティリティの整合性を識別しますが、単独で方向性を予測するものではありません。トレンド分析やサポート/レジスタンスレベルと併用することを検討してください。
__________________________________________________________________________________________
その他の無料インジケーター
構造や出来高から回帰、ボラティリティ、カスタム時間軸まで、幅広い市場分析ツールを探索してください。
ソースコードはGitHub リポジトリで入手可能です。
すべて無料で使用できますが、コーヒーサポートを送りたい場合は こちらからどうぞ。
サポート/レジスタンス
出来高
移動平均線
- SSLチャネル
- アンカード移動平均
- 偏差スケール移動平均
- ギャンハイローアクティベーター
- 瞬時トレンドライン
- カウフマン適応MAとトレンドビジョン
- 移動平均チャネル
- 移動平均スイート
- トレンドチャネル移動平均
ユーティリティ/カスタム
回帰ベース
ボラティリティ
オシレーター
__________________________________________________________________________________________
免責事項
トレーディングにはリスクが伴います。このインジケーターはテクニカル分析専用です — 常に適切なリスク管理を行い、責任を持って取引してください。
フィードバックと改善
ご提案、機能リクエスト、改善アイデアがあれば、ディスカッションタブにコメントを残してください。皆様のフィードバックはインジケーターの改善に役立ちます。