
설명
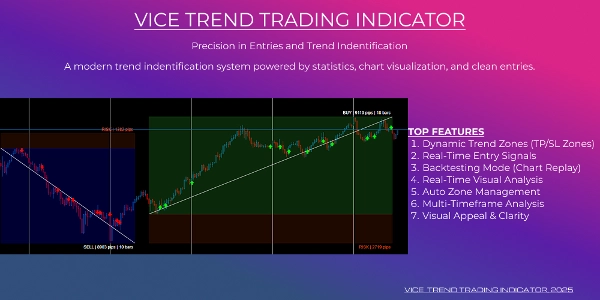
Vice TrendTrading
"다중 시간대 추세 논리에 기반한 고급 추세 구역 및 정밀 진입 화살표"
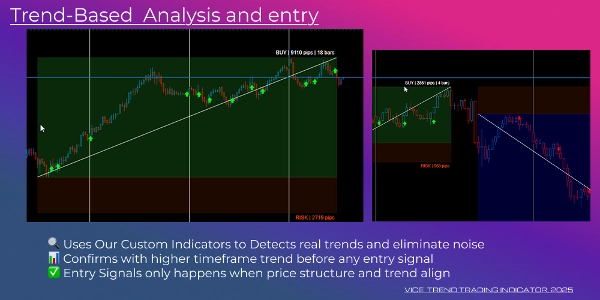
이것은 단순한 추세 지표가 아니라 — 완전한 시각적 거래 시스템으로, 시장 추세를 찾고, 실시간으로 시장 성과를 추적하며, 그리고 명확하게 추세 결과를 분석할 수 있도록 설계되었습니다.
이 고급 도구는 다중 시간대 추세 분석, 실시간 손익 오버레이, 그리고 자동 신호 화살표를 하나의 깔끔하고 강력한 차트 경험으로 결합합니다.
주요 특징:
1. 동적 추세 구역 (TP/SL 시각화)
요약
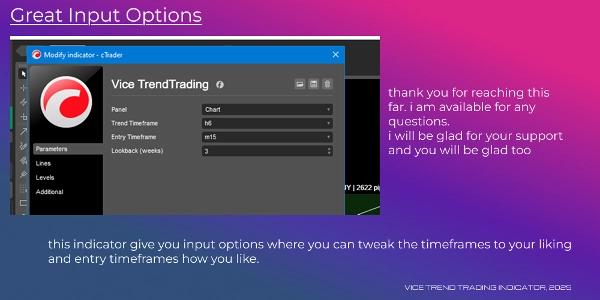
지표 프로필
고객 리뷰
4.5
리뷰: 2
5 | 50 % | |
4 | 50 % | |
3 | 0 % | |
2 | 0 % | |
1 | 0 % |
고객 리뷰
July 15, 2025
not perfect, but the workflow felt cleaner, and A small account test feels safer.
July 7, 2025
Not perfect, but the workflow felt cleaner. It needs a few bad trades in the sample too.
상담
자주 묻는 질문(FAQ)
트레이딩 봇, 지표, 플러그인 등 cTrader Store에서 제공되는 상품은 제3자 개발자에 의해 제공되며, 이는 단순히 정보 및 기술적 접근을 목적으로 제공된 것입니다. cTrader Store는 중개인이 아니며, 투자 조언, 개인별 추천 또는 향후 성과에 대한 어떠한 보장도 제공하지 않습니다.


!["[Stellar Strategies] Inside Bar with Signals" 로고](https://cdn.ctrader.com/image/webp/1d9e8bfa-3b2c-4440-bb37-5856902008a7_30683)


가격
가입일 17/06/2025