
설명
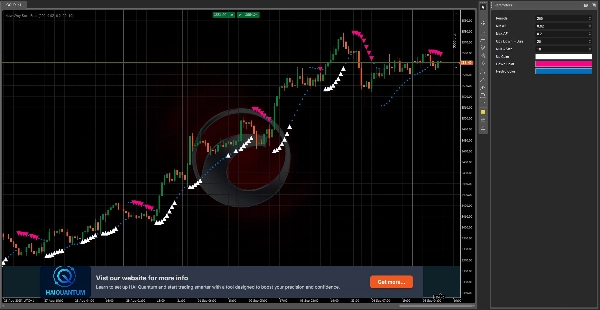
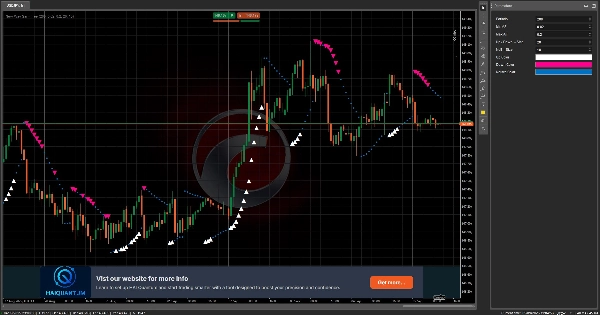
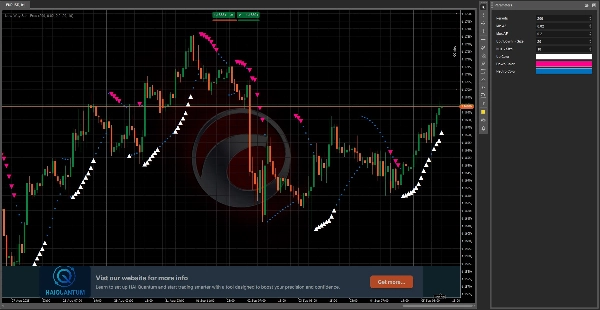
포물선 SAR 또는 "스톱 앤 리버스"는 트레이더가 잠재적인 추세 반전을 식별하고 추적 손절매 주문을 설정하는 데 도움이 되는 동적 기술 분석 도구입니다. 전통적인 지표와 달리, 포물선 SAR은 가격 움직임을 따라가는 일련의 점을 생성하며, 추세가 힘을 얻음에 따라 조정됩니다.
저희의 현대적인 버전은 이 고전적인 지표에 대해 새롭고 직관적인 접근 방식을 제공합니다. 강력하고 신뢰할 수 있는 신호와 깔끔하고 현대적인 디자인을 결합하여 트레이더가 추세 방향과 잠재적인 진입 또는 종료 지점을 쉽게 시각화할 수 있도록 돕습니다. 경험 많은 트레이더이든 이제 시작하는 초보자이든, 포물선 SAR: 현대 버전은 시장을 자신 있게 탐색하는 데 필요한 명확성과 정밀성을 제공합니다.
요약
지표 프로필
고객 리뷰
5.0
리뷰: 1
5 | 100 % | |
4 | 0 % | |
3 | 0 % | |
2 | 0 % | |
1 | 0 % |
고객 리뷰
October 8, 2025
A fresh twist on the classic SAR! ⚙️ Fast, light, and easy to read. Great for spotting quick trend flips, but add filters to avoid false turns on choppy markets."
상담
자주 묻는 질문(FAQ)
Prop
Forex
Signal
Indices
Supertrend
Commodities
Crypto
Stocks
트레이딩 봇, 지표, 플러그인 등 cTrader Store에서 제공되는 상품은 제3자 개발자에 의해 제공되며, 이는 단순히 정보 및 기술적 접근을 목적으로 제공된 것입니다. cTrader Store는 중개인이 아니며, 투자 조언, 개인별 추천 또는 향후 성과에 대한 어떠한 보장도 제공하지 않습니다.


가격
147
판매
11.18K
무료 설치