
SUPER TREND OSCILLATOR TRIAL DAY15
지표
43 다운로드
버전 1.0, Nov 2025
Windows, Mac
4.0
리뷰: 1

설명
슈퍼 트렌드 오실레이터 체험판 15일
"주의," 유료 버전에는 무료 15일 체험판도 제공됩니다" 유료 제품을 클릭하면 무료 버전을 찾을 수 있습니다-
간소화된 슈퍼트렌드 오실레이터 - 완전한 설명
개요
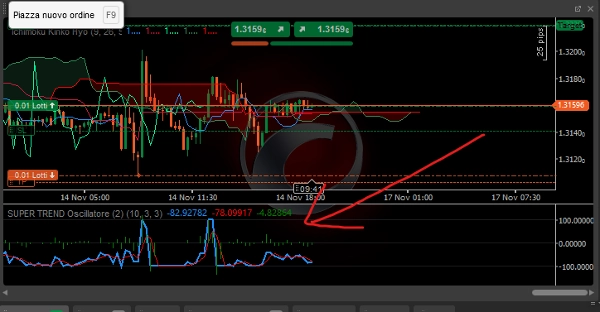
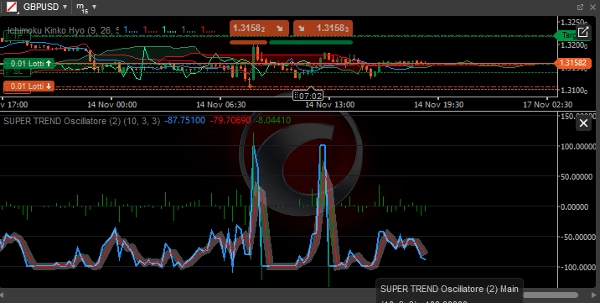
간소화된 슈퍼트렌드 오실레이터 는 cTrader용 고급 기술 지표로, 고전적인 슈퍼트렌드를 시각적 오실레이터로 변환하여 추세 방향, 강도 및 신뢰성을 쉽게 식별할 수 있게 합니다.
주요 구성 요소
1. 메인 라인 (파란색)
- 기능: 가격과 슈퍼트렌드 라인 간의 정규화된 거리 표시
- 계산:
((가격 - 슈퍼트렌드) / (ATR × 승수)) × 100 - 해석:
-
- > 0: 강세 추세 (가격이 슈퍼트렌드 위에 있음)
- < 0: 약세 추세 (가격이 슈퍼트렌드 아래에 있음)
- 범위: -100에서 +100까지
2. 신호선 (빨간색)
- 기능: 메인 라인의 단순 이동 평균
- 기간: 사용자 지정 가능 (기본값 3 기간)
- 사용법: 시장 잡음을 필터링하고 신호를 확인
3. 히스토그램 (회색)
- 기능: 메인 라인과 신호선 간의 차이
- 해석:
-
- 양수: 강세 모멘텀 가속화
- 음수: 약세 모멘텀 가속화
- 제로 크로스오버: 잠재적 모멘텀 반전
설정 가능한 매개변수
슈퍼트렌드 매개변수:
- ATR 기간: 평균 진폭 범위 계산 기간 (기본값: 10)
- 승수: 슈퍼트렌드 밴드 승수 (기본값: 3.0)
오실레이터 매개변수:
- 신호 기간: 신호선 기간 (기본값: 3)
신호 해석
추세 조건:
- 강한 강세 추세:
-
- 메인 > +50
- 메인 > 신호
- 양수 히스토그램
- 강한 약세 추세:
-
- 메인 < -50
- 메인 < 신호
- 음수 히스토그램
- 횡보 시장:
-
- 메인 -30에서 +30 사이
- 빈번한 라인 교차
거래 신호:
롱 진입:
- 메인이 0 위로 교차
- 히스토그램이 양수로 전환
- 신호선이 강세를 확인
- 모멘텀을 위해 메인이 +20 이상
숏 진입:
- 메인이 0 아래로 교차
- 히스토그램이 음수로 전환
- 신호선이 약세를 확인
- 모멘텀을 위해 메인이 -20 이하
청산/이익 실현:
- 롱: 메인 > +80 (과매수) 또는 신호선 아래로 교차
- 숏: 메인 < -80 (과매도) 또는 신호선 위로 교차
간소화 버전의 장점
1. 최적화된 성능
- 더 효율적인 계산
- 낮은 자원 소비
- 가격 변화에 대한 빠른 반응
2. 사용 용이성
- 필수 매개변수 감소
- 즉각적인 시각 신호
- 초보자도 쉽게 해석 가능
3. 신뢰성
- 노이즈에 덜 민감함
- 더 깨끗하고 명확한 신호
- 고전적인 슈퍼트렌드보다 거짓 신호 감소
사용 전략
추세 추종 전략:
- 진입: 롱은 메인 > 0, 숏은 메인 < 0
- 필터: 히스토그램이 메인과 같은 부호
- 청산: 부호 반전 또는 극단적 수준 도달 시
모멘텀 전략:
- 진입: 롱은 메인 > +30, 숏은 메인 < -30
- 확인: 히스토그램 가속화
- 청산: 모멘텀 감속 (히스토그램 감소)
평균 회귀 전략:
- 진입: 숏은 메인 > +80, 롱은 메인 < -80
- 확인: 히스토그램 반전
- 청산: 중립 구역으로 회귀
최적 시장 조건
추세 시장:
- 높은 효율성
- 지속적인 신호
- 적은 휘핑
횡보 시장:
- 포지션 크기 축소
- 시간 프레임 연장
- 모멘텀 필터로 사용
최선의 실천법
권장 시간 프레임:
- 일중 거래: M15 - H1
- 스윙 트레이딩: H4 - D1
- 포지션 트레이딩: W1 - MN
위험 관리:
- 손절매: 1.5-2 × ATR
- 이익 실현: 2-3 × 위험
- 포지션 크기: 거래당 1-2%
추가 확인 사항:
- 다중 시간 프레임 정렬
- 거래량 확인
- 주요 지지/저항 수준
제한 사항
고려 사항:
- 내재된 지연 (추세 추종 지표)
- 횡보 시장에서 성능 저하
- 저변동성에서 확인 필요
권장 사항:
- 가격 행동 분석과 결합
- 독립 시스템이 아닌 필터로 사용
- 실거래 전 데모 테스트
이 오실레이터는 강한 추세를 식별하고 거짓 신호를 필터링하는 강력한 도구를 제공하며, 초보자와 경험자 모두에게 적합한 운영의 단순성을 유지합니다.
요약
지표 프로필
고객 리뷰
4.0
리뷰: 1
5 | 0 % | |
4 | 100 % | |
3 | 0 % | |
2 | 0 % | |
1 | 0 % |
고객 리뷰
November 24, 2025
Super Trend Oscillator combines trend direction with momentum, giving clean color-coded signals and smooth transitions. Great for timing entries and filtering noise across all timeframes. Trial version works well but lacks alerts. Full version would shine with notifications and extended filters.
상담
자주 묻는 질문(FAQ)
BTCUSD
Forex
Signal
EURUSD
Commodities
GBPUSD
XAUUSD
트레이딩 봇, 지표, 플러그인 등 cTrader Store에서 제공되는 상품은 제3자 개발자에 의해 제공되며, 이는 단순히 정보 및 기술적 접근을 목적으로 제공된 것입니다. cTrader Store는 중개인이 아니며, 투자 조언, 개인별 추천 또는 향후 성과에 대한 어떠한 보장도 제공하지 않습니다.
이 작성자의 상품 더 보기


가격
12
판매
1.49K
무료 설치