present
가입하고 첫 구매 시 $50 할인을 받으세요
34
판매
1.06K
무료 설치

설명

MACD Advanced — 지표 설명

MACD Advanced는 cTrader용 고전적인 MACD 지표의 전문 업그레이드 버전입니다. 표준 MACD 논리를 풍부한 시각 도구와 분석 레이어와 결합하여 트레이더에게 시장 모멘텀, 추세 강도 및 변동성 조건에 대한 훨씬 더 깊은 통찰을 하나의 패널에서 제공합니다.


모멘텀 색상 히스토그램

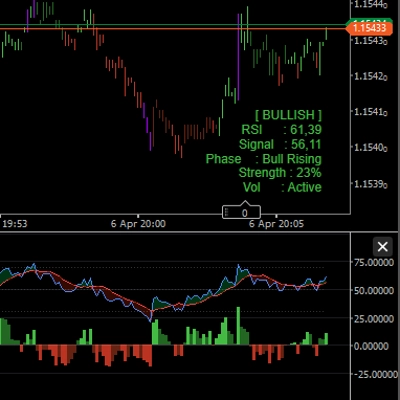
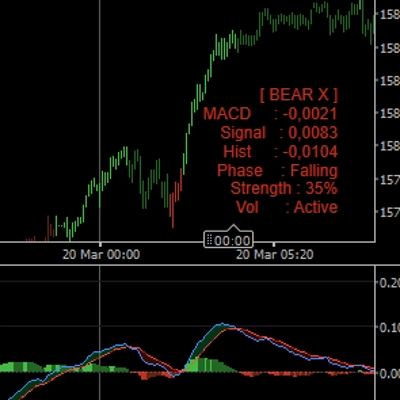
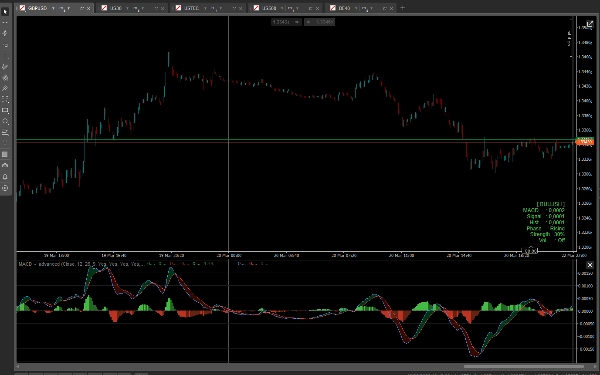
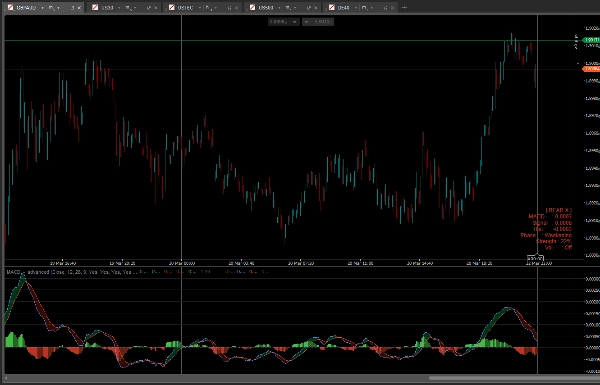
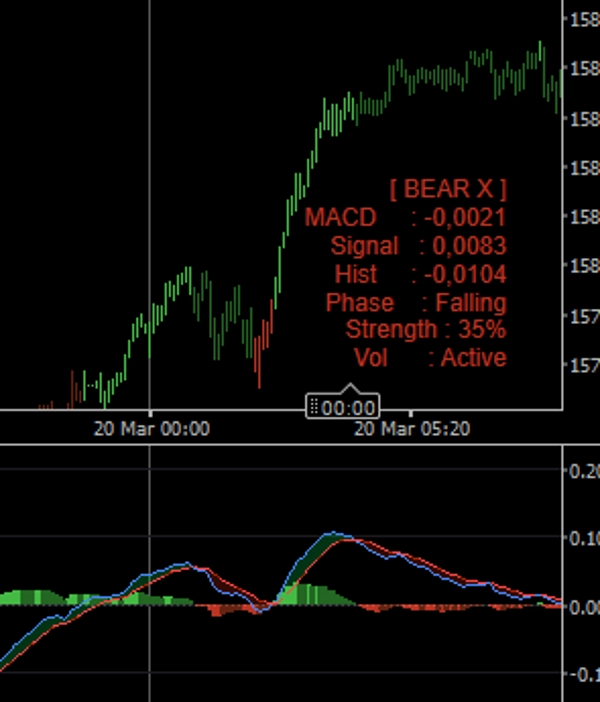
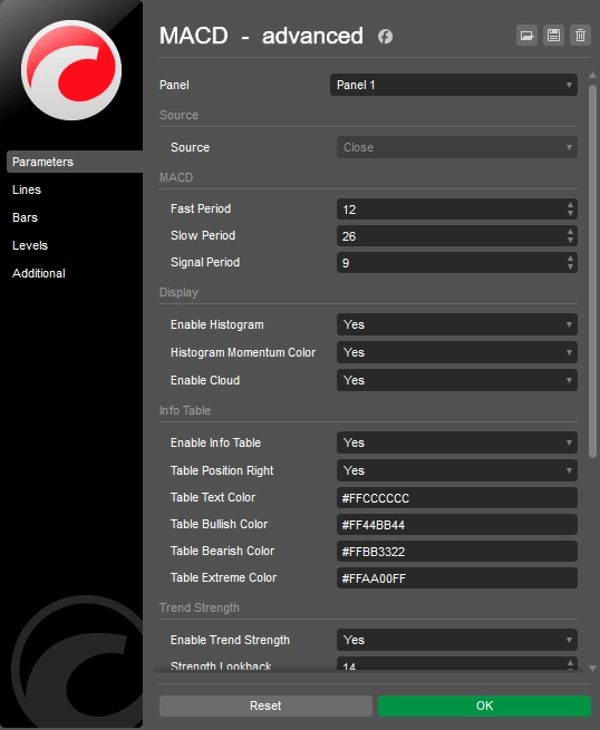
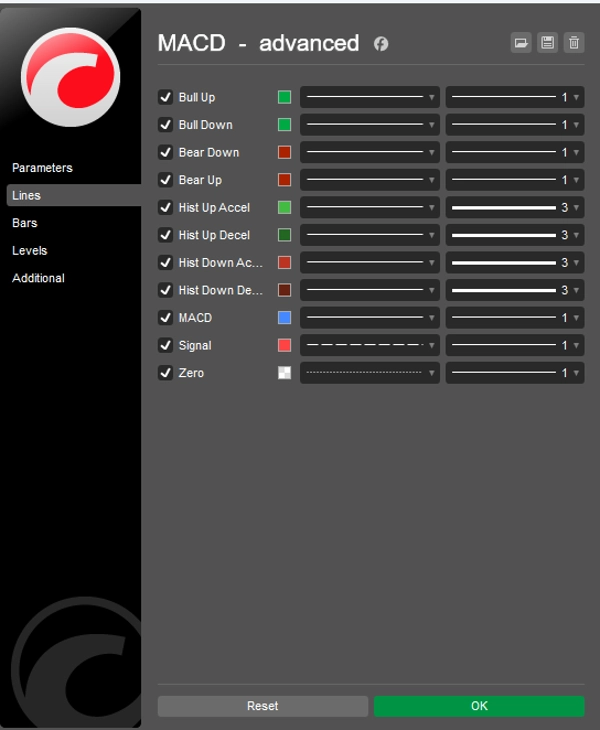
히스토그램은 MACD와 시그널 라인 간의 차이를 표시하며 네 가지 시장 상태를 구분하기 위해 네 가지 별도의 색상을 사용합니다: 강세 가속, 강세 감속, 약세 가속, 약세 감속. 이를 통해 수동 계산 없이 모멘텀이 증가하는지 감소하는지를 즉시 알 수 있습니다.


MACD 클라우드

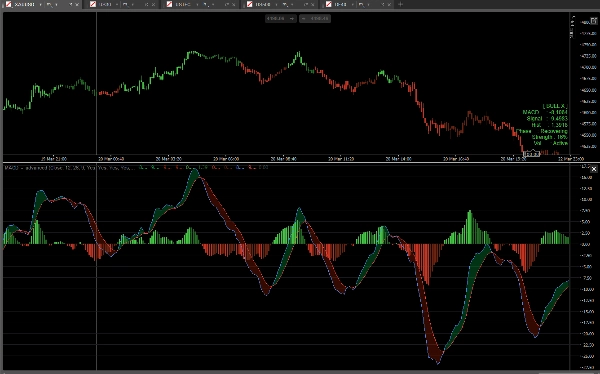
선택적 클라우드가 MACD와 시그널 라인 사이 영역을 채웁니다. MACD가 시그널 위에 있을 때(강세 편향) 녹색 클라우드가 형성되고, MACD가 시그널 아래에 있을 때(약세 편향) 빨간색 클라우드가 형성됩니다. 클라우드는 한눈에 추세 방향을 즉시 시각적으로 읽을 수 있게 해줍니다.


추세 강도

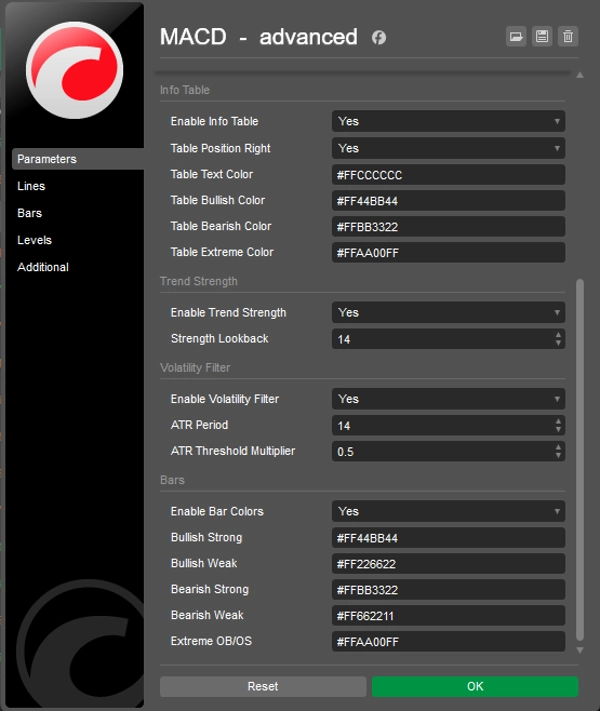
지표는 구성 가능한 조회 기간 동안 MACD와 시그널 라인 간의 분리를 기반으로 실시간 추세 강도 점수를 계산합니다. 결과는 정보 테이블에 백분율로 표시되어 현재 움직임이 얼마나 강하거나 약한지 평가하는 데 도움을 줍니다.


변동성 필터

선택적 ATR 기반 변동성 필터는 저변동성 기간 동안 신호를 억제합니다. 활성화되면 변동성이 구성 가능한 임계값 아래로 떨어질 때 히스토그램 막대와 막대 색상이 중립 회색으로 변경되어 조용한 시장에서의 잘못된 판독을 방지합니다.


정보 테이블

컴팩트한 차트 내 테이블은 현재 시장 상태(강세, 약세, 강세 교차, 약세 교차, 중립), 정확한 MACD 및 시그널 값, 히스토그램 값, 사이클 단계(상승, 약화, 회복, 하락), 추세 강도 백분율 및 변동성 필터 상태를 표시합니다. 테이블 위치(왼쪽 또는 오른쪽)와 모든 색상은 완전히 구성 가능합니다.


막대 색상

활성화 시, 지표는 MACD 조건에 따라 차트 캔들을 재색칠합니다: 강한 강세, 약한 강세, 약한 약세, 강한 약세 및 낮은 변동성. 이를 통해 패널을 전환하지 않고도 MACD 신호를 가격 차트에 직접 표시할 수 있습니다.


주요 기능 요약

  • 4가지 색상의 모멘텀 히스토그램
  • MACD와 시그널 라인 사이의 MACD 클라우드
  • 실시간 백분율 추세 강도 점수
  • 시각적 피드백이 있는 ATR 기반 변동성 필터
  • 전체 시장 상태 분석이 포함된 차트 내 정보 테이블
  • MACD 조건에 따른 선택적 캔들 색상 변경
  • 알파 채널 지원을 포함한 모든 색상 완전 사용자 지정 가능
  • 깔끔하고 가벼움 — 리페인팅 없음

요약

AI 요약
MACD Advanced is a professional indicator for cTrader that enhances the classic MACD by integrating multiple visual and analytical tools into a single panel. It provides a detailed view of market momentum, trend strength, and volatility. Key features include a four-color momentum histogram that distinguishes between bullish and bearish acceleration or deceleration, and an optional MACD cloud that visually indicates trend direction by shading the area between the MACD and Signal lines in green or red. The indicator calculates a real-time trend strength score as a percentage based on the MACD and Signal line separation over a configurable period. An optional ATR-based volatility filter suppresses signals during low-volatility phases by changing histogram colors to neutral grey, reducing false signals. A compact on-chart info table displays current market state, MACD and Signal values, histogram data, cycle phase, trend strength, and volatility filter status, with customizable position and colors. Additionally, candle bars can be recolored based on MACD conditions to reflect strong or weak bullish/bearish trends and low volatility directly on the price chart. All colors support alpha channel customization. The indicator is designed to be clean, lightweight, and free from repainting. It supports various markets including Forex, indices, commodities, stocks, and cryptocurrencies.
지표 프로필

상담

고객 리뷰

4.3
리뷰: 6
5
33 %
4
67 %
3
0 %
2
0 %
1
0 %
고객 리뷰
April 6, 2026
April 4, 2026
April 1, 2026
the best part is the process slows down in a good way, and a 1R exit plan makes review easier.
March 28, 2026
Helps more when the trader avoids forced trades. Account protection still comes first.
March 27, 2026
Solid enough as a backup opinion. It is just a support layer.
March 25, 2026
Fine for a side read, especially when the chart is not clean. It can add noise if overused.

자주 묻는 질문(FAQ)

BTCUSD
Forex
Signal
Indices
EURUSD
Commodities
GBPUSD
NZDUSD
Prop
Scalping
Crypto
Stocks
XAUUSD
NAS100
ATR
MACD
USDJPY
트레이딩 봇, 지표, 플러그인 등 cTrader Store에서 제공되는 상품은 제3자 개발자에 의해 제공되며, 이는 단순히 정보 및 기술적 접근을 목적으로 제공된 것입니다. cTrader Store는 중개인이 아니며, 투자 조언, 개인별 추천 또는 향후 성과에 대한 어떠한 보장도 제공하지 않습니다.

가격

34
판매
1.06K
무료 설치