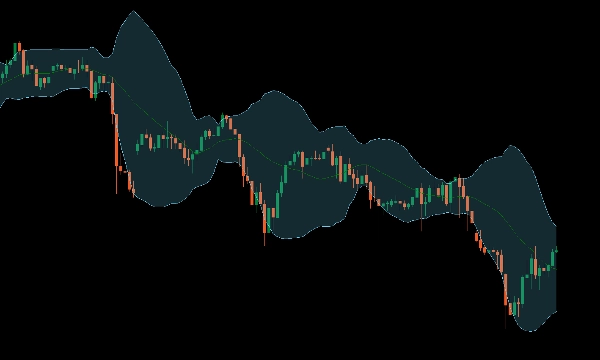
지표
NAS100
NZDUSD
Breakout
XAUUSD
Commodities
Forex
Signal
EURUSD
Bollinger
GBPUSD
BTCUSD
Indices
Prop
Stocks
Crypto
USDJPY
Scalping
Bollinger Bands Cloud
"Bollinger Bands Cloud" 로고
18/10/2025
Desktop
가입일 25/09/2025
판매
2
"Bollinger Bands Cloud" 업로드된 이미지"Bollinger Bands Cloud" 업로드된 이미지"Bollinger Bands Cloud" 업로드된 이미지

Introducing our enhanced Bollinger Bands indicator, designed to elevate your trading experience with clearer visualization.

This visual enhancement makes it easier to interpret market volatility and identify potential breakout and reversal points. Ideal for traders seeking clearer insights and improved decision-making.

Upgrade your trading toolkit today for sharper analysis and better results.

0.0
리뷰: 0
고객 리뷰
이 상품에 대한 리뷰가 아직 없습니다. 이미 사용해 보셨나요? 다른 사람들에게 가장 먼저 소개해 주세요!
이 작성자의 상품 더 보기
지표
NAS100
NZDUSD
XAUUSD
+13
Chandelier Exit
Optimize exits with Chandelier Exit! Visualize stop-loss points dynamically for improved trading precision and safety.
지표
NAS100
NZDUSD
Breakout
+12
ATR Bands
Enhance trading with ATR Bands! Visualize market volatility using dynamic upper and lower ATR bands for precise decision
지표
NAS100
NZDUSD
XAUUSD
+11
Consolidation Zones
Identify and trade breakouts with Consolidation Zones! Visualize price consolidation areas for trading opportunities.
지표
NAS100
NZDUSD
XAUUSD
+13
MACD Crossover PRO
Customize the MACD! Choose colors, get real-time tick updates, and see crossover points for enhanced trading precision.
지표
NAS100
NZDUSD
XAUUSD
+13
MACD Histogram PRO
Enhance MACD Histogram! Visualize bull and bear price changes with vibrant colors for clearer, more insightful trading.
지표
NAS100
NZDUSD
XAUUSD
+12
QQE Qualitative Quantity Estimation
Unlock trading precision with QQE! Dual QQE indicators with a Bollinger Bands zero line provide clear buy/sell signals.
지표
NAS100
NZDUSD
XAUUSD
+10
Relative Moving Average
Bring the RMA to cTrader! This is the Relative Moving Average from TradingView.
지표
NAS100
NZDUSD
Breakout
+13
VWAP Volume Weighted Average Price
Unlock VWAP in cTrader! Choose anchor periods, price sources, and display deviation bands with real-time tick updates.
지표
NAS100
NZDUSD
XAUUSD
+10
Moving Average PRO
Customize your Moving Average! Choose any timeframe and price source for precision and flexibility in your analysis.
지표
Grid
NAS100
NZDUSD
+13
Standard Deviation Channel
Visualize trends with Standard Deviation Channel! Display median, and add customizable upper/lower deviation channels.
좋아하실 만한 다른 항목
지표
Bollinger
Repiptor BB Colored Width
Colored Bollinger Bands Width
지표
XAUUSD
Breakout
Stocks
+6
Final Moving Average
Final Moving Average is an adaptive system designed to keep traders aligned with the true direction of the market
지표
Signal
dark-cloud
The Dark Cloud Cover indicator detects a bearish reversal pattern, marking key candles and confirming signals based on v
지표
RSI
EURUSD
MACD
Supply&Demand
Precision Supply & Demand zones indicator—automatically plots key buy/sell areas on your chart for smarter entries.
IR Moving Average
 this moving include everything that a trader needs from Moving Average.
Volume Profile Triple Line - POC Median Mode
The Advanced Volume Profile Indicator calculates POC, Median, and Mode, revealing key price levels for smarter trading.
Ctreder Smart SMA Indicator
cTreder Smart SMA
지표
RSI
Breakout
XAUUSD
+5
Prediction Based on Linreg & ATR
📊Predicts price movement by combining multi-timeframe trend analysis, market volatility 📉, and..
지표
NAS100
NZDUSD
Breakout
+17
Deviation Indicator by PrimeQuant
True Deviation - Trade extremes and reversions with deviation channels, SMC swings, liquidity levels, and impulse bias.
지표
Indices
RSI
Stocks
+3
Advanced RSI Indicator
Advanced RSI Indicator with multi-MA smoothing, Bollinger Bands, divergence detection, and fill zones for cTrader.
지표
Forex
VegaXLR - Auto Support and Resistance
cTrader Auto Support & Resistance detects key levels with Fibonacci analysis and sends real-time trading alerts.
지표
Breakout
ORB v1
Opening Range Breakout (ORB) - Visual Edition
지표
Breakout
AutoLines™ Support & Resistance
FlexSR auto‑detects pivot highs/lows to plot dynamic support & resistance lines Features customizable styling and option
E7 Polynomial Regression Channel
Polynomial Regression Channel which also reflects the volatility of the underlying asset.
최고 평점
"STC" 로고
5.0
(2)
무료
지표
MACD
STC
Schaff Trend Cycle (STC) Indicator
지표
RSI
Signal
MA-RSI HTF Confirmation
MA-RSI HTF Confirmation: Eliminate false signals and trade with confidence!
Supply Demand V1-Premium
Auto-detect supply & demand zones, remove broken levels, and trade smarter with real-time alerts. Precision made simple.
지표
Grid
Indices
Prop
+4
Round Numbers
Automatically draws major, minor, and trace support/resistance levels at round numbers