
Pozwala użytkownikom oznaczać godziny otwarcia i zamknięcia głównych sesji handlowych — azjatyckiej, londyńskiej, nowojorskiej oraz zamknięcia Londynu — za pomocą konfigurowalnych kolorów, stylów i grubości. Ten wskaźnik rysuje linie trendu wysokie i niskie dla każdej sesji, dostarczając wglądu w zachowanie rynku. Dzięki przyjaznej dla użytkownika funkcji przeciągnij i upuść (+klawisz Alt) umożliwia szybkie wyznaczanie wysokich i niskich punktów sesji. Idealny zarówno dla początkujących, jak i doświadczonych traderów, ten wskaźnik ułatwia poruszanie się po złożonościach różnych sesji rynkowych.
Funkcje
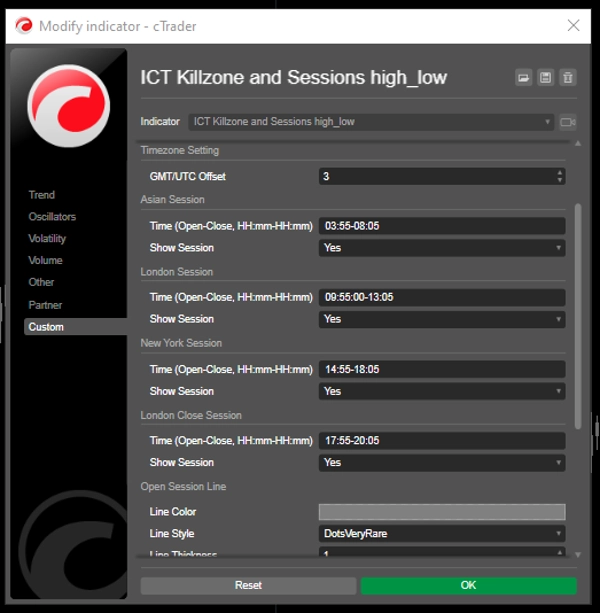
Konfigurowalne godziny sesji: Użytkownicy mogą definiować godziny otwarcia i zamknięcia głównych sesji handlowych (azjatyckiej, londyńskiej, nowojorskiej oraz zamknięcia Londynu), co pozwala na dostosowaną wizualizację odpowiadającą ich strategiom handlowym.
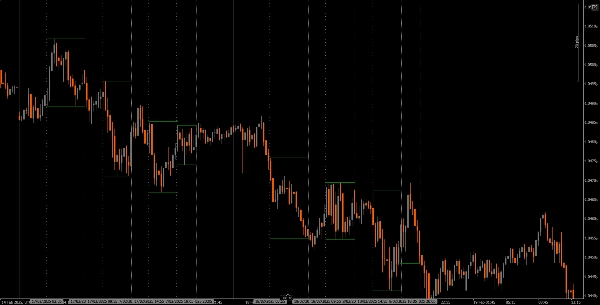
Dynamiczne linie pionowe: Wskaźnik rysuje pionowe linie w godzinach otwarcia i zamknięcia sesji, co ułatwia szybkie zidentyfikowanie kluczowych wydarzeń rynkowych.
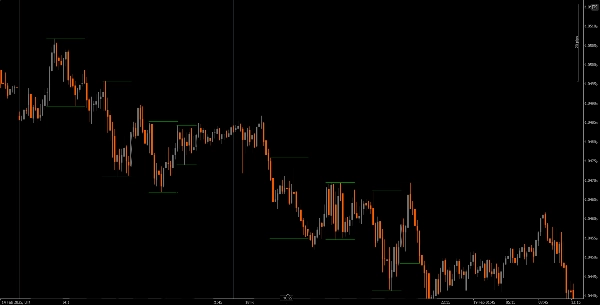
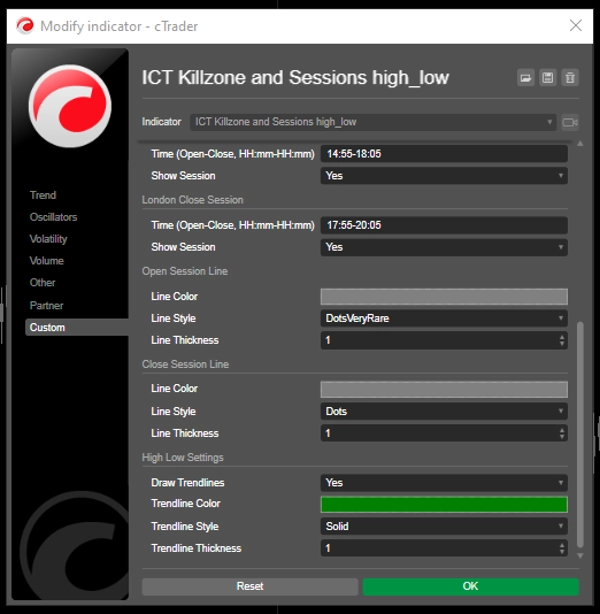
Wizualizacja linii trendu: Może automatycznie rysować wysokie i niskie linie trendu dla każdej sesji, pozwalając traderom zobaczyć potencjalne poziomy wsparcia i oporu na podstawie ruchów cenowych sesji.
Przyjazna funkcja przeciągnij i upuść (+klawisz Alt): Funkcja przeciągnij i upuść (+klawisz Alt) umożliwia traderom łatwy wybór określonych zakresów czasowych do analizy, poprawiając ogólne doświadczenie użytkownika.
Etykiety sesji: Opcja wyświetlania etykiet obok linii trendu sesji dodaje przejrzystości, pomagając traderom szybko zidentyfikować, którą sesję analizują.
Dostosowanie strefy czasowej: Użytkownicy mogą ustawić przesunięcie GMT/UTC, zapewniając dokładne przedstawienie godzin sesji zgodnie z ich lokalną strefą czasową.
Samouczek
Instalacja: Pobierz i zainstaluj wskaźnik The ICT Killzone and Sessions high_low na swojej platformie cAlgo.
Konfiguracja: Otwórz ustawienia, aby dostosować godziny sesji, kolory, style linii i grubości według własnych preferencji.
Używanie wskaźnika: Kliknij i przeciągnij (+klawisz Alt) na wykresie, aby utworzyć prostokąt obejmujący zakres czasowy, który chcesz analizować. Wskaźnik automatycznie narysuje linie pionowe i linie trendu dla określonych sesji.
Analiza: Obserwuj linie sesji i linie trendu podczas handlu. Wykorzystaj te informacje do identyfikacji potencjalnych poziomów wsparcia i oporu na podstawie dynamiki sesji.
Polecane narzędzia towarzyszące
cTrader: Natywna platforma dla cAlgo, zapewniająca płynne doświadczenie w używaniu i dostosowywaniu wskaźników.
Narzędzia analizy rynku: Połącz ten wskaźnik z narzędziami analizy rynku, takimi jak średnie kroczące lub oscylatory, aby wzmocnić swoją strategię handlową.
Narzędzia zarządzania ryzykiem: Używaj kalkulatorów wielkości pozycji i narzędzi stop-loss, aby skutecznie zarządzać ryzykiem podczas handlu.
Integrując wskaźnik The ICT Killzone and Sessions high_low z tymi narzędziami, traderzy mogą poprawić swoją analizę rynku i zwiększyć szanse na sukces w poruszaniu się po złożonościach różnych sesji handlowych.
5 | 40 % | |
4 | 20 % | |
3 | 0 % | |
2 | 0 % | |
1 | 40 % |


