
Rsi + Volume
Wskaźnik
707 pobrania
Wersja 1.0, Mar 2025
Windows, Mac
5.0
Opinie: 3
Od 21/02/2025
466.3M
Wolumen transakcji
180.83K
Zysk w pipsach
22
Sprzedaż
6.92K
Bezpłatne instalacje
Opis
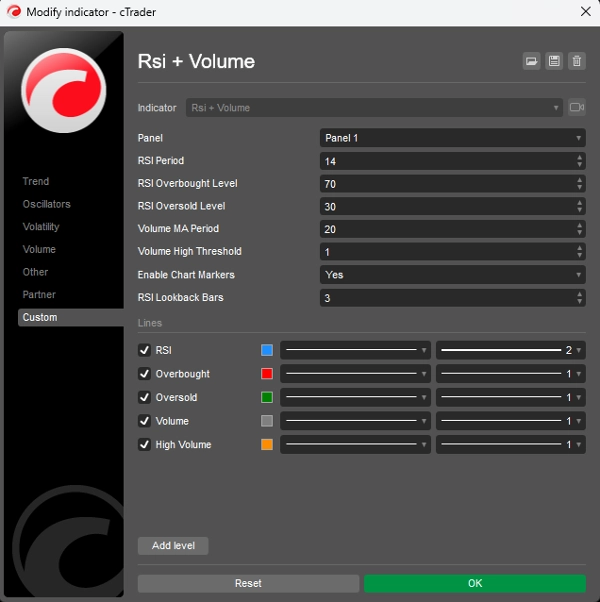
Ten wskaźnik łączy RSI (Relative Strength Index) z analizą wolumenu, aby generować bardziej wiarygodne sygnały handlowe. Działa na zasadzie, że znaczące ruchy cen powinny być poparte wysokim wolumenem, aby potwierdzić siłę ruchu.
Kluczowe elementy:
- Analiza RSI:
-
- Mierzy szybkość i zmianę ruchów cen na skali od 0 do 100
- Identyfikuje warunki wykupienia (powyżej 70) i wyprzedania (poniżej 30)
- Pomaga dostrzec potencjalne punkty zwrotne na rynku
- Analiza wolumenu:
-
- Porównuje bieżący wolumen z średnią kroczącą ostatnich wolumenów
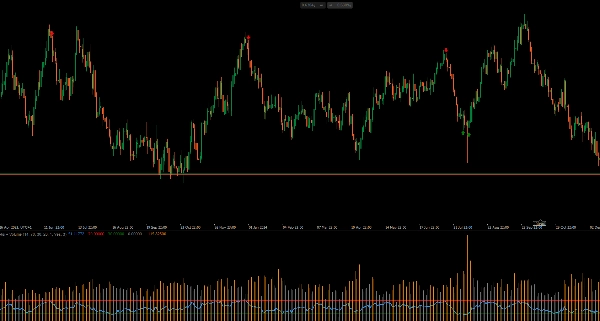
- Wyróżnia okresy wysokiego wolumenu (pomarańczowe słupki histogramu)
- Potwierdza siłę stojącą za ruchami cen
- Generowanie sygnałów:
-
- Sygnał kupna: gdy RSI przebija poziom wyprzedania (30) przy wysokim wolumenie
- Sygnał sprzedaży: gdy RSI przebija poziom wykupienia (70) przy wysokim wolumenie
- Wizualne sygnały pojawiają się bezpośrednio na wykresie (zielone strzałki w górę dla kupna, czerwone strzałki w dół dla sprzedaży)
Jak go używać:
- Szukaj sygnałów kupna, gdy cena jest w trendzie spadkowym, a RSI wskazuje warunki wyprzedania
- Szukaj sygnałów sprzedaży, gdy cena jest w trendzie wzrostowym, a RSI wskazuje warunki wykupienia
- Wyższy wolumen potwierdza siłę sygnału
- Dostosuj parametry (okres RSI, próg wolumenu) do swojego interwału handlowego
Ten wskaźnik pomaga odfiltrować fałszywe sygnały, wymagając zarówno potwierdzenia RSI, jak i wolumenu powyżej średniej, co czyni go bardziej wiarygodnym niż używanie samego RSI.
Podsumowanie
Podsumowanie AI
The "Rsi + Volume" indicator integrates the Relative Strength Index (RSI) with volume analysis to enhance the reliability of trading signals. It operates on the principle that significant price movements should be confirmed by high trading volume.
Key components include:
1. RSI Analysis:
- Measures the speed and change of price movements on a 0-100 scale.
- Identifies overbought conditions (above 70) and oversold conditions (below 30).
- Helps detect potential market reversal points.
2. Volume Analysis:
- Compares current volume against a moving average of recent volume.
- Highlights periods of high volume using orange histogram bars.
- Confirms the strength behind price movements.
Signal generation occurs when RSI crosses key thresholds with accompanying high volume:
- Buy signals trigger when RSI rises above the oversold level (30) with high volume.
- Sell signals trigger when RSI falls below the overbought level (70) with high volume.
Visual signals appear directly on the chart as green up arrows for buys and red down arrows for sells.
Users can adjust parameters such as RSI period and volume threshold to fit their trading timeframe. This indicator aims to filter out false signals by requiring both RSI confirmation and above-average volume, providing more dependable trade signals than RSI alone.
Profil wskaźnika
Opinie klientów
5.0
Opinie: 3
5 | 100 % | |
4 | 0 % | |
3 | 0 % | |
2 | 0 % | |
1 | 0 % |
Opinie klientów
October 12, 2025
Hello, the RSI +volume indicator is perfect, but it needed to have something: when the little arrow appears on the chart, it could show a notification or an alarm. Would you be able to add that alarm or notification in cTrader?
August 12, 2025
Pros: Combines RSI and volume for stronger trading signals. Works well when RSI threshold intersects with high volume spikes. Lightweight and clear visuals. Cons: No alerts or tooltips. Lacks template saving. May generate noise on low-volume timeframes without additional filters.
Dyskusja
Częste pytania
Signal
Indices
RSI
Produkty dostępne za pośrednictwem cTrader Store, w tym boty handlowe, wskaźniki i wtyczki, dostarczane są przez deweloperów zewnętrznych i udostępniane wyłącznie w celach informacyjnych oraz w celu zapewnienia dostępu technicznego. cTrader Store nie jest brokerem i nie zapewnia doradztwa inwestycyjnego, nie udziela spersonalizowanych rekomendacji ani nie gwarantuje przyszłych wyników.


Cena
Od 21/02/2025
466.3M
Wolumen transakcji
180.83K
Zysk w pipsach
22
Sprzedaż
6.92K
Bezpłatne instalacje