
Opis
https://chartshots.spotware.com/c/695bff3f3bc21
https://chartshots.spotware.com/c/695bffac03fb1
https://chartshots.spotware.com/c/695c0002aabb7
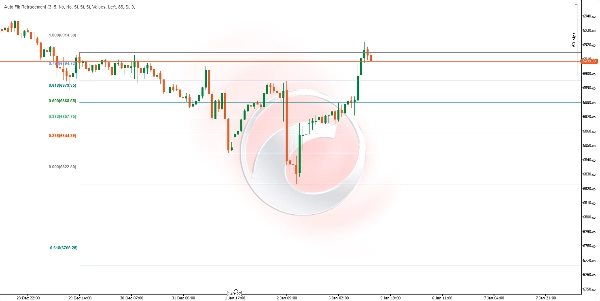
📊 Auto Fib Retracement
Auto Fib Retracement jest wskaźnikiem analizy technicznej, który automatycznie rysuje poziomy zniesień i rozszerzeń Fibonacciego na podstawie najnowszych istotnych ruchów cenowych. W przeciwieństwie do ręcznych narzędzi Fibonacciego, ten wskaźnik automatycznie wykrywa punkty zwrotne rynku i aktualizuje poziomy w czasie rzeczywistym.
⚙️ Jak to działa?
Automatyczne wykrywanie punktów zwrotnych
Wskaźnik wykorzystuje dynamiczny algorytm ZigZag do identyfikacji istotnych szczytów i dołków cenowych:
- Okres wstecz (Głębokość): Określa, ile świec jest analizowanych wstecz, aby potwierdzić punkt zwrotny. Wyższa wartość wykrywa większe wahania; niższa jest bardziej czuła na mniejsze ruchy.
- Czułość (Odchylenie): Kontroluje, jak znaczący musi być ruch cenowy, aby utworzyć nowy punkt zwrotny. Obliczana jest przez pomnożenie 10-okresowego ATR (Średni Rzeczywisty Zasięg) przez ten współczynnik. Wyższe wartości filtrują szumy i wykrywają tylko ważne ruchy.
Obliczanie poziomów Fibonacciego
Gdy zostaną zidentyfikowane dwa ostatnie punkty zwrotne (szczyt i dołek), wskaźnik oblicza każdy poziom za pomocą klasycznego wzoru Fibonacciego:
Poziom = Cena kotwicy + (Zakres ruchu × Współczynnik Fibonacciego)
Gdzie:
- Cena kotwicy: Cena ostatniego punktu zwrotnego (lub poprzedniego, jeśli kierunek się odwraca)
- Zakres ruchu: Różnica między dwoma punktami zwrotnymi
- Dostępne współczynniki: 0, 0.236, 0.382, 0.5, 0.618, 0.65, 0.786, 1, 1.272, 1.414, 1.618, 1.65, 2.618, 2.65, 3.618, 3.65, 4.236, 4.618, oraz poziomy ujemne (-0.236, -0.382, -0.618, -0.65)
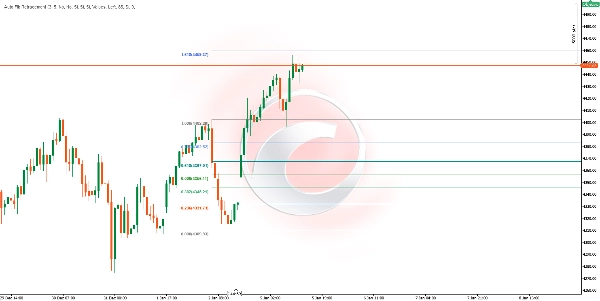
📈 Do czego to służy?
UseDescription
Identyfikacja wsparcia i oporu
Poziomy 0.382, 0.5 i 0.618 to klasyczne strefy, gdzie cena zwykle reaguje 🔵
Określanie celów cenowych
Poziomy rozszerzeń (1.618, 2.618, 3.618, 4.236) pomagają przewidzieć, jak daleko może się posunąć ruch 🎯
Planowanie wejść
Szukaj cofnięć do kluczowych poziomów, aby wejść w kierunku trendu ⬆️⬇️
Ustawianie stop-lossów
Umieszczaj stop lossy poza istotnymi poziomami Fibonacciego 🛑
Potwierdzanie stref odwrócenia
Gdy cena osiąga ekstremalne poziomy rozszerzeń, może to wskazywać na wyczerpanie 🔄
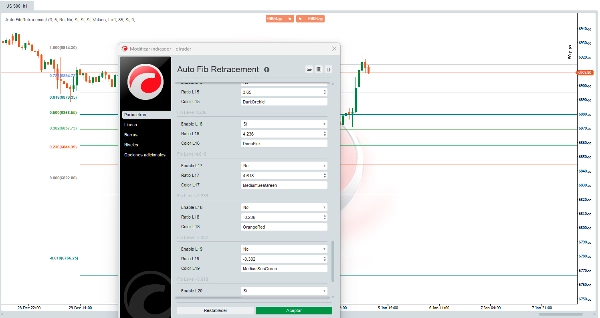
🛠️ Jak z tego korzystać
Główne parametry
ParametrOpisZalecana wartość
Czułość
Mnożnik odchylenia do filtrowania drobnych ruchów
3 (domyślnie)
Okres wstecz
Minimalna liczba świec do obliczenia punktów zwrotnych
10 (domyślnie)
Odwróć kierunek
Odwraca punkt odniesienia do obliczania poziomów
Wyłączone
Opcje wyświetlania
OpcjaFunkcja
Rozszerz w lewo / prawo
Rozciąga poziome linie na lewo lub prawo wykresu
Wyświetl ceny
Pokazuje dokładną cenę każdego poziomu
Wyświetl współczynniki
Pokazuje współczynnik Fibonacciego (wartości lub procenty)
Pozycja etykiety
Ustawia etykiety po lewej lub prawej stronie
Przezroczystość stref
Kontroluje przezroczystość kolorowych stref między poziomami
Konfigurowalne poziomy Fibonacciego
Każdy z 22 poziomów może być:
- Indywidualnie włączany lub wyłączany
- Modyfikowany pod względem wartości liczbowej
- Zmiana koloru
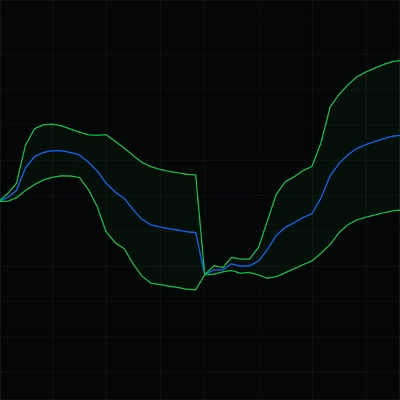
💡 Interpretacja stref
Kolorowe strefy między kolejnymi poziomami ułatwiają wizualną identyfikację:
- Zielono/Niebieskie strefy (0.382 - 0.786): Obszar zdrowego cofnięcia w trendach. Typowa strefa do szukania wejść. ✅
- Strefa poziomu 1.0: Reprezentuje 100% poprzedniego ruchu. Działa jako kluczowe wsparcie/opór. ⚖️
- Czerwono/Różowe strefy (1.618+): Rozszerzenia ruchu. Cena osiągająca te strefy może wskazywać na nadmierne rozciągnięcie. ⚠️
⚠️Uwagi
- Wskaźnik aktualizuje się automatycznie gdy wykryje nowe istotne punkty zwrotne
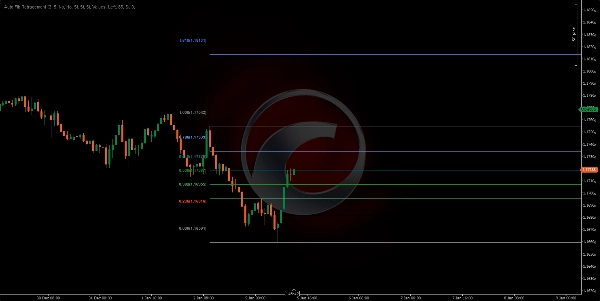
- Działa na dowolnym interwale czasowym i aktywie finansowym
- Poziomy Fibonacciego to strefy prawdopodobieństwa, a nie gwarancje
- Zaleca się używać w połączeniu z innymi wskaźnikami lub analizą price action
- Na rynkach bocznych lub niestabilnych punkty zwrotne mogą się często zmieniać
📝 Uwagi techniczne
- Wewnętrznie używany jest 10-okresowy ATR do obliczania dynamicznego progu wykrywania punktów zwrotnych
- Wskaźnik wymaga minimalnej ilości danych historycznych równej dwukrotności parametru Okres wstecz aby działać poprawnie
- Linie i strefy są rysowane ponownie tylko na ostatniej świecy w celu optymalizacji wydajności 🚀
Podsumowanie
The indicator helps traders identify potential support and resistance zones, define price targets, plan entries on pullbacks, set stop-losses beyond key levels, and confirm reversal zones when price reaches extreme extensions. It works on any timeframe and financial asset, including Forex, stocks, commodities, indices, and cryptocurrencies such as BTCUSD, EURUSD, GBPUSD, XAUUSD, NAS100, and others.
Users can customize parameters like sensitivity, lookback period, direction inversion, and display options (line extension, price and ratio labels, zone opacity, and colors). Colored zones visually highlight key Fibonacci areas for easier interpretation. The indicator updates automatically with new pivots and redraws levels on the latest bar to optimize performance.


![Logo „[Stellar Strategies] MARSI Signal Plotter”](https://cdn.ctrader.com/image/webp/7b2b8da6-8f8e-4646-8d4a-4710c516c01e_25567)


