
To narzędzie pozwala użytkownikom określić ramy czasowe do analizy, takie jak dzienne, i nanieść na wykresy poziomy maksymalne i minimalne z możliwością dostosowania kolorów, stylów i grubości. Obsługuje wiele poprzednich dni, co ułatwia identyfikację istotnych stref akcji cenowej. Wskaźnik posiada również opcjonalne etykiety dla przejrzystości, pomagając traderom podejmować świadome decyzje na podstawie historycznych danych cenowych. Idealny zarówno dla początkujących, jak i doświadczonych traderów, to narzędzie wzbogaca analizę rynku i strategie handlowe.
Funkcje
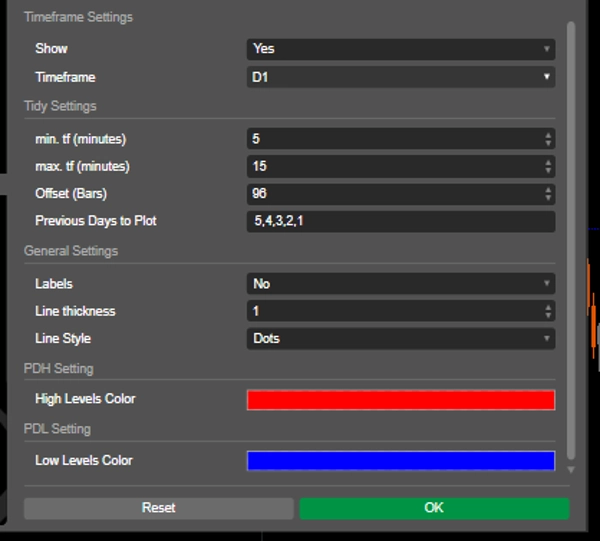
Dostosowywalne ramy czasowe: Użytkownicy mogą wybrać określony przedział czasowy (np. dzienny) do analizy poprzednich maksimów i minimów, co pozwala na dostosowaną wizualizację odpowiadającą ich strategiom handlowym.
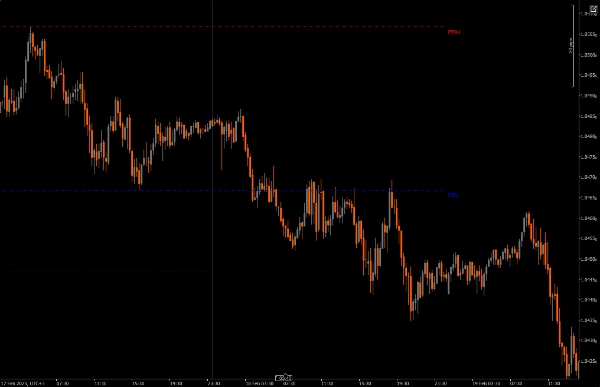
Wiele poprzednich dni: Możliwość naniesienia poziomów maksymalnych i minimalnych dla wielu poprzednich dni zapewnia kompleksowy obraz istotnych stref akcji cenowej.
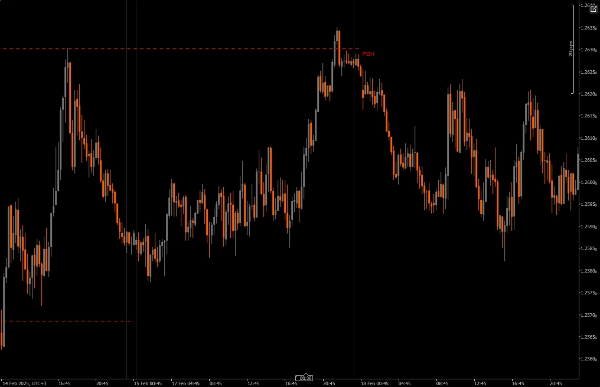
Dynamiczne linie trendu: Wskaźnik rysuje linie trendu dla maksymalnego i minimalnego poziomu poprzedniego dnia, co ułatwia szybkie zidentyfikowanie potencjalnych stref odwrócenia.
Opcje etykietowania: Użytkownicy mogą włączyć etykiety wyświetlające aktualne wartości maksymalne i minimalne bezpośrednio na wykresie, zwiększając przejrzystość i zrozumienie.
Personalizacja wizualna: Traderzy mogą dostosować kolory linii, style i grubości, aby dopasować je do swoich preferencji i poprawić czytelność wykresu.
Ograniczenia ram czasowych: Wskaźnik działa tylko w określonych minimalnych i maksymalnych ustawieniach ram czasowych, zmniejszając ilość bałaganu na wykresie podczas przełączania między innymi ramami czasowymi.
Ważne informacje
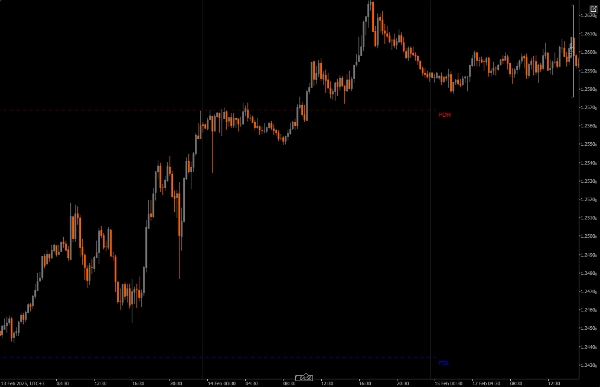
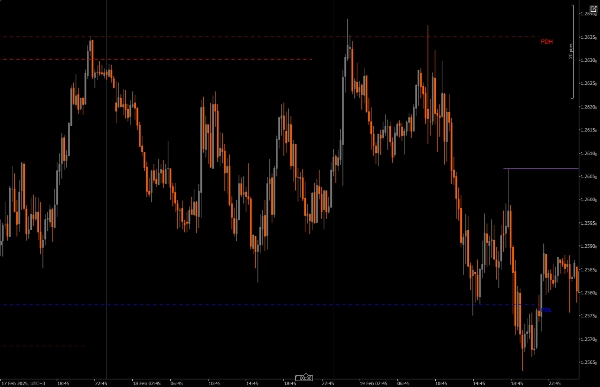
PDH lub PDL na rynku mogą być używane jako punkt odniesienia dla płynności (DOL) lub do wyznaczania odwrócenia.
Odwrócenia mogą być wyznaczane na podstawie PDH i PDL, gdy następuje niepowodzenie w przesunięciu.
Gdy cena respektuje zestaw PD powyżej lub poniżej, nie udaje się przesunąć ponad dzienny poziom maksymalny lub minimalny, można przewidzieć kolejny świecznik.
Czy cena jest bardziej skłonna sięgnąć poprzedniego dziennego maksimum czy minimum? Przy użyciu PDH PDL jako punktu odniesienia dla płynności (DOL)
Instalacja: Pobierz i zainstaluj Daily Range Liquidity Zones (PDH PDL) na swojej platformie cAlgo.
Konfiguracja: Otwórz ustawienia wskaźnika i wybierz pożądany przedział czasowy do analizy, liczbę poprzednich dni do naniesienia oraz dostosuj parametry wizualne, takie jak kolor i grubość linii.
Używanie wskaźnika: Wskaźnik automatycznie naniesie na wykres poziomy maksymalne i minimalne poprzedniego dnia na podstawie określonych ustawień.
Analiza: Obserwuj naniesione poziomy podczas handlu. Wykorzystaj te poziomy do wyznaczania potencjalnych odwróceń i podejmowania świadomych decyzji handlowych.
Polecane narzędzia towarzyszące
cTrader: Natywna platforma dla cAlgo, zapewniająca płynne środowisko do używania i dostosowywania wskaźników.
Narzędzia analizy technicznej: Połącz ten wskaźnik z innymi narzędziami, takimi jak Fair Value Gaps (FVG) i wskaźniki wzorców odwrócenia (CRT), aby wzbogacić swoją strategię handlową i analizę rynku.
Narzędzia zarządzania ryzykiem: Wykorzystaj kalkulatory wielkości pozycji i narzędzia stop-loss, aby skutecznie zarządzać ryzykiem podczas handlu wokół zidentyfikowanych poziomów maksymalnych i minimalnych.
Integrując Daily Range Liquidity Zones (PDH PDL) z tymi narzędziami, traderzy mogą wzbogacić swoją analizę rynku i zwiększyć szanse na sukces w poruszaniu się po złożonościach akcji cenowej.
5 | 100 % | |
4 | 0 % | |
3 | 0 % | |
2 | 0 % | |
1 | 0 % |