
Deskripsi
Lelah menghabiskan waktu lama menandai grafik Anda? Indikator ini melakukannya untuk Anda dengan sangat cepat.
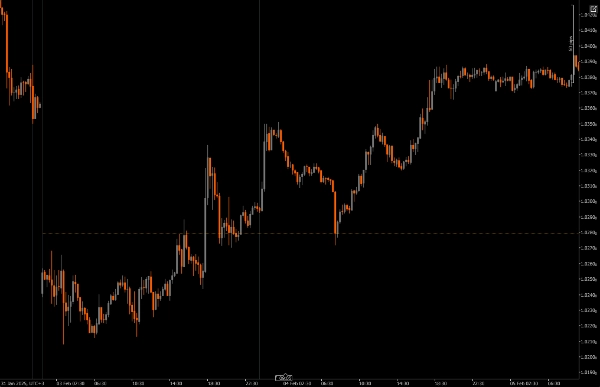
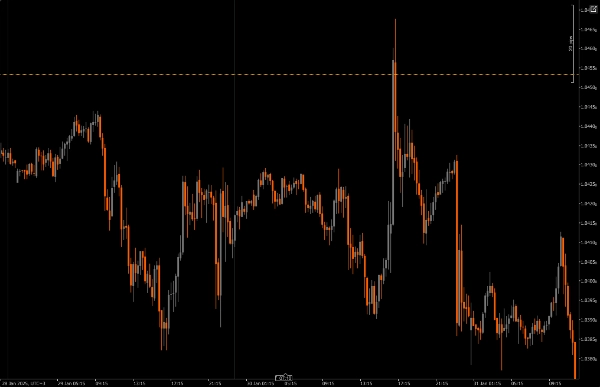
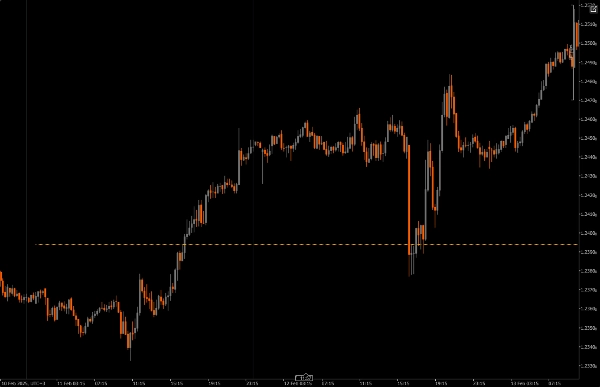
Ini menemukan titik tengah antara harga tertinggi dan terendah hari sebelumnya, dan memplotnya di grafik Anda. Sekarang Anda bisa memindai grafik Anda dengan sangat cepat. Mudah sekali!
Beberapa Fitur Keren
Kerangka Waktu Referensi yang Dapat Disesuaikan: Anda dapat memilih kerangka waktu minimum dan maksimum untuk memplot level harga signifikan, yang membantu menyelaraskan perdagangan intraday Anda dengan tren pasar yang lebih luas.
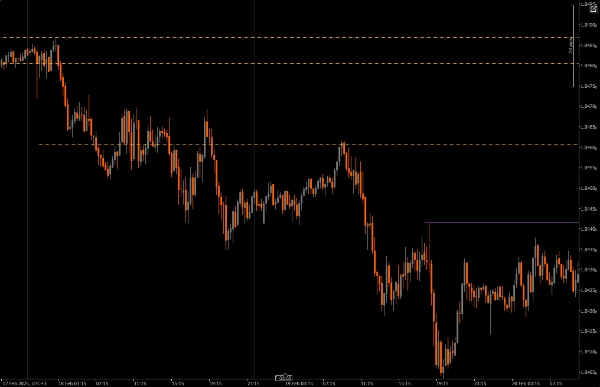
Yang membuat indikator ini istimewa adalah kemampuannya mengikuti candle mingguan saat dicetak dari hari ke hari sehingga memudahkan menangkap perluasan candle mingguan.
Parameter Offset: Fitur ini memungkinkan Anda menentukan seberapa jauh ke masa depan level yang dipetakan meluas, memberi Anda gambaran yang lebih jelas tentang zona kelanjutan harga potensial di masa depan.
Kustomisasi Visual: Anda memiliki banyak opsi untuk mengubah gaya garis, ketebalan, dan warna, sehingga mudah membuat grafik yang sesuai dengan gaya pribadi Anda dan mudah dibaca.
Pembatasan Kerangka Waktu: Indikator ini menyertakan pemeriksaan untuk memastikan hanya bekerja dalam pengaturan kerangka waktu yang Anda tentukan, sehingga Anda dapat menghindari kekacauan grafik saat beralih ke kerangka waktu lain.
Hal yang Perlu Diperhatikan:
Favorit pribadi
Apakah Anda seperti saya yang tidak bisa jauh dari lipstik di grafik Anda, maka coba indikator ini. Memiliki pembatasan kerangka waktu dan fungsi periode tinjau kembali yang bertujuan mengurangi kekacauan grafik.
Indikator ini berguna untuk mengikuti bagaimana candle mingguan berkembang; Jika perluasan mingguan menunjukkan tanda-tanda aliran order bullish maka level pivot pada indikator ini memvisualisasikan area atau zona untuk bergabung dengan perluasan bullish, demikian pula jika perluasan mingguan menunjukkan aliran order bearish maka level pivot pada indikator ini memvisualisasikan area atau zona untuk bergabung dengan perluasan bearish.
Instalasi: Mulailah dengan mengunduh dan menginstal Previous Day Equilibrium di platform cAlgo Anda.
Pengaturan: Buka pengaturan untuk memilih kerangka waktu referensi Anda, pilih berapa hari sebelumnya yang ingin Anda plot, dan sesuaikan pengaturan visual sesuai keinginan Anda.
Analisis: Saat Anda berdagang, perhatikan level yang dipetakan di grafik Anda. Level ini menunjukkan di mana harga mungkin berbalik berdasarkan aksi harga historis, membantu Anda membuat keputusan yang lebih tepat.
Eksekusi: Gunakan level ini untuk menentukan titik masuk dan keluar Anda, serta order stop-loss dan take-profit, mengintegrasikannya ke dalam strategi perdagangan keseluruhan Anda.
Alat Pendamping yang Direkomendasikan:
cTrader: Ini adalah platform terbaik untuk menggunakan Previous Day Equilibrium, memberikan pengalaman yang lancar untuk kustomisasi dan analisis.
Alat Analisis Teknis: Padukan indikator ini dengan alat lain seperti moving averages atau oscillator untuk mendapatkan pandangan yang lebih lengkap tentang tren pasar.
Alat Manajemen Risiko: Gunakan kalkulator dan alat stop-loss untuk membantu mengelola risiko Anda secara efektif saat berdagang di sekitar level-level kunci ini.
Dengan menggunakan Previous Day Equilibrium, bersama dengan alat-alat ini, Anda dapat meningkatkan strategi perdagangan Anda dan meningkatkan peluang keberhasilan dalam dunia perdagangan intraday yang cepat.
Ringkasan
Ulasan pelanggan
5 | 0 % | |
4 | 100 % | |
3 | 0 % | |
2 | 0 % | |
1 | 0 % |


