
Описание
Он позволяет пользователям отмечать время открытия и закрытия основных торговых сессий — Азиатской, Лондонской, Нью-Йоркской и закрытия Лондона — с настраиваемыми цветами, стилями и толщиной. Этот индикатор рисует линии тренда максимумов и минимумов для каждой сессии, предоставляя понимание поведения рынка. Благодаря удобной функции перетаскивания (+ клавиша Alt) построение максимумов и минимумов сессий становится быстрым. Идеально подходит как для новичков, так и для опытных трейдеров, этот индикатор облегчает навигацию по сложностям различных рыночных сессий.
Особенности
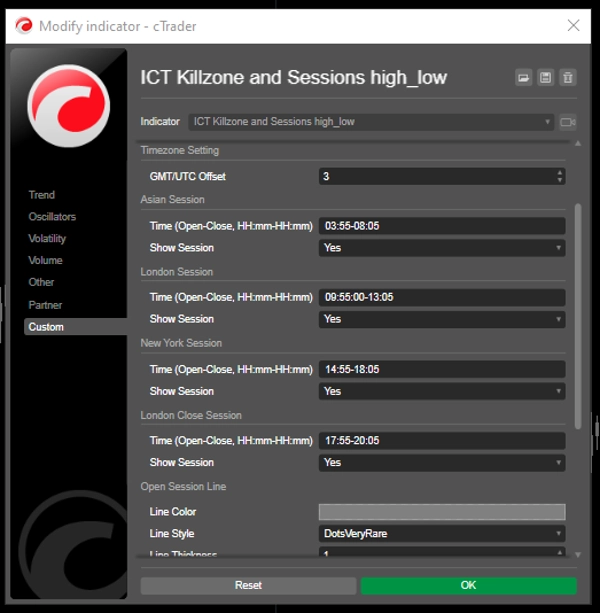
Настраиваемое время сессий: пользователи могут задавать время открытия и закрытия основных торговых сессий (Азиатская, Лондонская, Нью-Йоркская и закрытие Лондона), что позволяет адаптировать визуализацию под свои торговые стратегии.
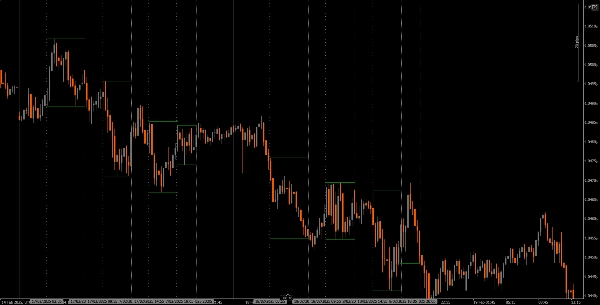
Динамические вертикальные линии: индикатор рисует вертикальные линии в моменты открытия и закрытия сессий, что облегчает быстрое определение ключевых рыночных событий.
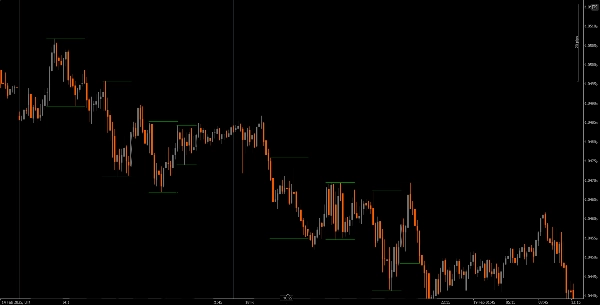
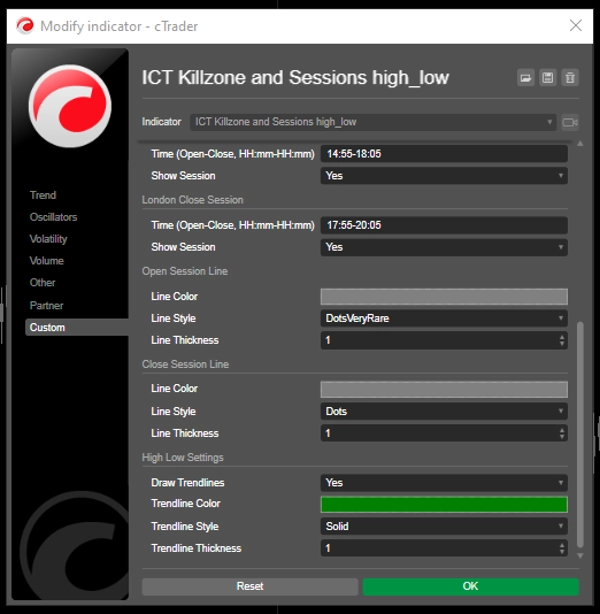
Визуализация линий тренда: он может автоматически рисовать линии тренда максимумов и минимумов для каждой сессии, позволяя трейдерам видеть потенциальные уровни поддержки и сопротивления на основе ценового действия сессии.
Удобное перетаскивание (+ клавиша Alt): функция перетаскивания (+ клавиша Alt) позволяет трейдерам легко выбирать определённые временные диапазоны для анализа, улучшая общий пользовательский опыт.
Метки сессий: возможность отображать метки рядом с линиями тренда сессий добавляет ясности, помогая трейдерам быстро определить, какую сессию они анализируют.
Корректировка часового пояса: пользователи могут установить смещение GMT/UTC, обеспечивая точное отображение времени сессий в соответствии с их местным часовым поясом.
Руководство
Установка: скачайте и установите индикатор The ICT Killzone and Sessions high_low на вашу платформу cAlgo.
Настройка: откройте настройки, чтобы настроить время сессий, цвета, стили линий и толщину в соответствии с вашими предпочтениями.
Использование индикатора: нажмите и перетащите (+ клавиша Alt) на графике, чтобы создать прямоугольник, охватывающий временной диапазон, который вы хотите проанализировать. Индикатор автоматически нарисует вертикальные линии и линии тренда для указанных сессий.
Анализ: наблюдайте за линиями сессий и линиями тренда во время торговли. Используйте эту информацию для определения потенциальных уровней поддержки и сопротивления на основе динамики сессий.
Рекомендуемые сопутствующие инструменты
cTrader: родная платформа для cAlgo, обеспечивающая бесшовный опыт использования и настройки индикаторов.
Инструменты анализа рынка: сочетайте этот индикатор с инструментами анализа рынка, такими как скользящие средние или осцилляторы, чтобы улучшить вашу торговую стратегию.
Инструменты управления рисками: используйте калькуляторы размера позиции и инструменты стоп-лосс для эффективного управления рисками при торговле.
Интегрируя индикатор The ICT Killzone and Sessions high_low с этими инструментами, трейдеры могут улучшить анализ рынка и повысить свои шансы на успех в навигации по сложностям различных торговых сессий.
Сводка
A drag-and-drop (+Alt Key) feature allows quick selection of specific time ranges for analysis. Optional session labels clarify which session is being viewed. Timezone adjustments via GMT/UTC offset ensure session times align with the trader’s local time zone.
Designed for use on the cAlgo platform, this tool supports enhanced market analysis when combined with other market analysis and risk management tools. It assists traders in navigating the complexities of different market sessions by providing clear visual cues and trendline insights.
Отзывы покупателей
5 | 40 % | |
4 | 20 % | |
3 | 0 % | |
2 | 0 % | |
1 | 40 % |


