
Description
Il permet aux utilisateurs de marquer les heures d'ouverture et de fermeture des principales sessions de trading — Asie, Londres, New York et clôture de Londres — avec des couleurs, styles et épaisseurs personnalisables. Cet indicateur trace des lignes de tendance hautes et basses pour chaque session, fournissant des informations sur le comportement du marché. Grâce à une fonctionnalité conviviale de glisser-déposer (+ touche Alt), il facilite le tracé rapide des hauts et bas des sessions. Parfait pour les traders débutants comme expérimentés, cet indicateur simplifie la navigation dans la complexité des différentes sessions de marché.
Fonctionnalités
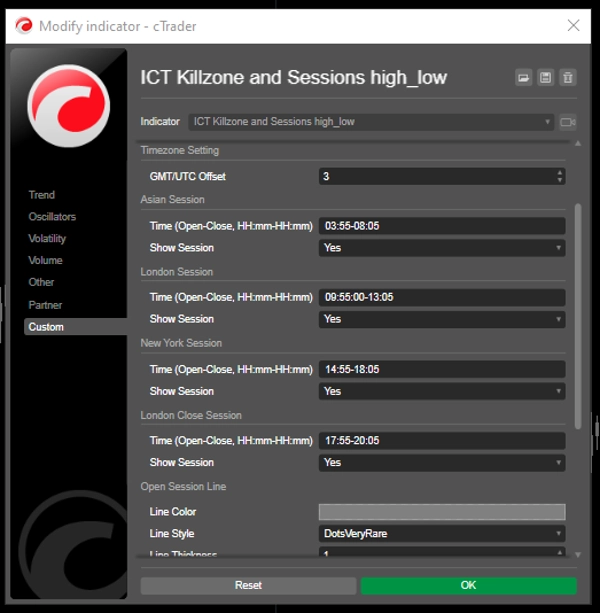
Heures de session personnalisables : Les utilisateurs peuvent définir les heures d'ouverture et de fermeture des principales sessions de trading (Asie, Londres, New York et clôture de Londres), permettant une visualisation adaptée à leurs stratégies de trading.
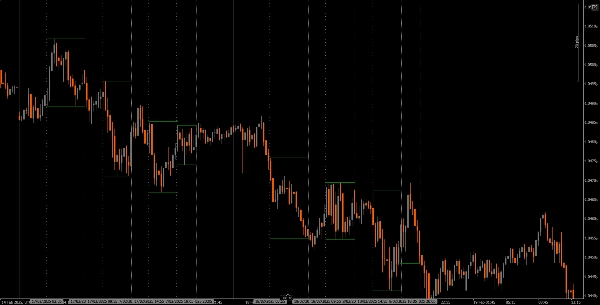
Lignes verticales dynamiques : L'indicateur trace des lignes verticales aux heures d'ouverture et de fermeture des sessions, facilitant l'identification rapide des événements clés du marché.
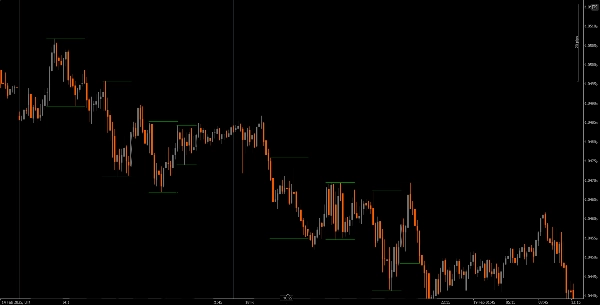
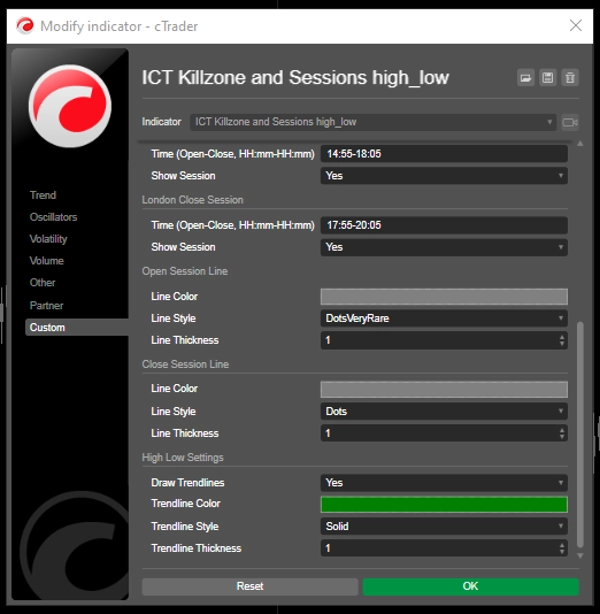
Visualisation des lignes de tendance : Il peut automatiquement tracer des lignes de tendance hautes et basses pour chaque session, permettant aux traders de voir les niveaux potentiels de support et de résistance basés sur l'action des prix de la session.
Glisser-déposer convivial (+ touche Alt) : La fonctionnalité de glisser-déposer (+ touche Alt) permet aux traders de sélectionner facilement des plages horaires spécifiques à analyser, améliorant ainsi l'expérience utilisateur globale.
Étiquettes de session : L'option d'afficher des étiquettes à côté des lignes de tendance des sessions ajoute de la clarté, aidant les traders à identifier rapidement la session qu'ils analysent.
Ajustement du fuseau horaire : Les utilisateurs peuvent définir un décalage GMT/UTC, garantissant que les heures des sessions sont représentées avec précision selon leur fuseau horaire local.
Tutoriel
Installation : Téléchargez et installez l'indicateur The ICT Killzone and Sessions high_low sur votre plateforme cAlgo.
Configuration : Ouvrez les paramètres pour personnaliser vos heures de session, couleurs, styles de ligne et épaisseurs selon vos préférences.
Utilisation de l'indicateur : Cliquez et faites glisser (+ touche Alt) sur le graphique pour créer un rectangle englobant la plage horaire que vous souhaitez analyser. L'indicateur tracera automatiquement des lignes verticales et des lignes de tendance pour les sessions spécifiées.
Analyse : Observez les lignes de session et les lignes de tendance pendant que vous tradez. Utilisez ces informations pour identifier les niveaux potentiels de support et de résistance basés sur la dynamique des sessions.
Outils complémentaires recommandés
cTrader : La plateforme native pour cAlgo, offrant une expérience fluide pour l'utilisation et la personnalisation des indicateurs.
Outils d'analyse de marché : Combinez cet indicateur avec des outils d'analyse de marché, tels que les moyennes mobiles ou les oscillateurs, pour améliorer votre stratégie de trading.
Outils de gestion des risques : Utilisez des calculateurs de taille de position et des outils de stop-loss pour gérer efficacement le risque lors du trading.
En intégrant l'indicateur The ICT Killzone and Sessions high_low avec ces outils, les traders peuvent améliorer leur analyse de marché et augmenter leurs chances de succès dans la navigation des complexités des différentes sessions de trading.
Résumé
A drag-and-drop (+Alt Key) feature allows quick selection of specific time ranges for analysis. Optional session labels clarify which session is being viewed. Timezone adjustments via GMT/UTC offset ensure session times align with the trader’s local time zone.
Designed for use on the cAlgo platform, this tool supports enhanced market analysis when combined with other market analysis and risk management tools. It assists traders in navigating the complexities of different market sessions by providing clear visual cues and trendline insights.
Avis clients
5 | 40 % | |
4 | 20 % | |
3 | 0 % | |
2 | 0 % | |
1 | 40 % |


