
Drawing Utility
Wskaźnik
210 pobrania
Wersja 1.0, Jul 2025
Windows, Mac
Opis
Alt + Przeciągnij, aby aktywować to na swoich wykresach.
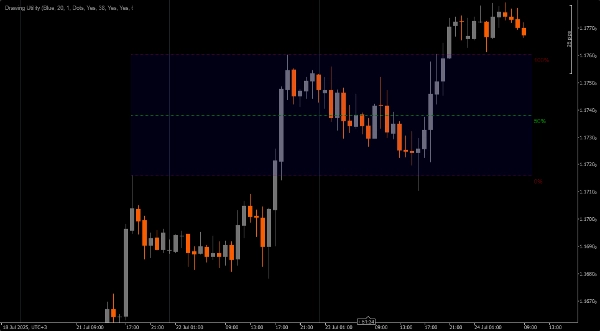
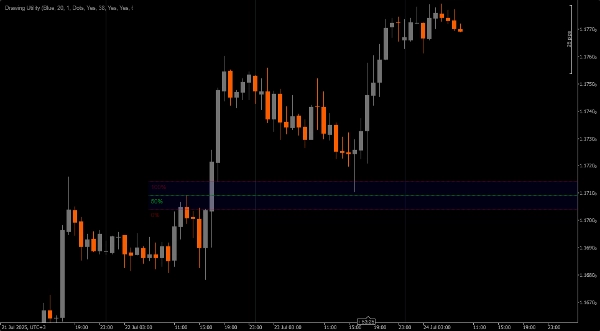
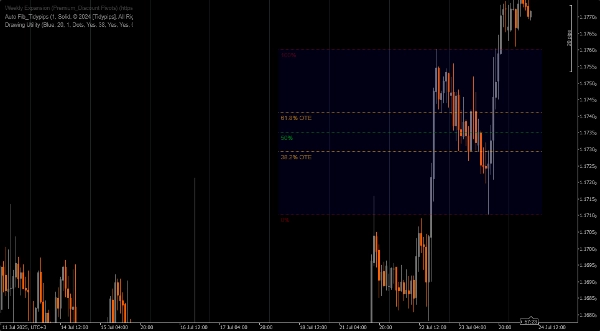
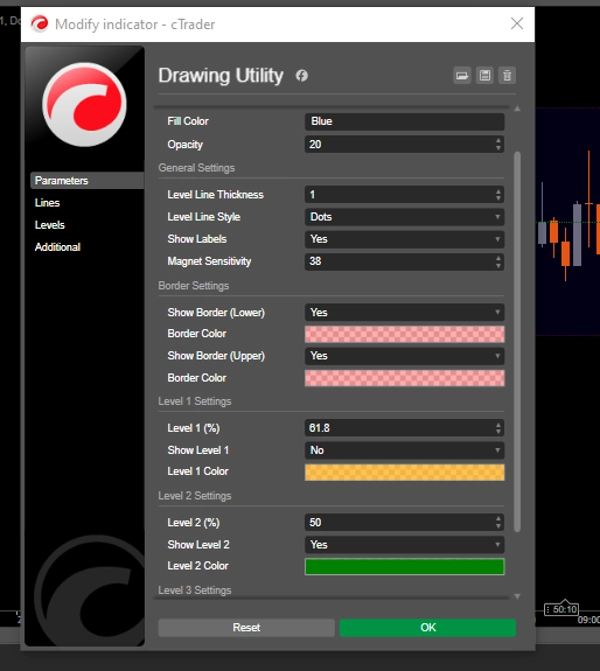
Narzędzie do rysowania z możliwością dostosowania.
1. Szybki dostęp do Fibonacciego.
2. Marker luki wartości godziwej
3. Narzędzie pomiarowe
4. Marker punktu zainteresowania
5. lub inne zastosowanie (o którym nie pomyślałem), które może być odpowiednie do oznaczania Twoich wykresów
UWAGA **Alt + Przeciągnij, aby aktywować to na swoich wykresach.**
Podsumowanie
Podsumowanie AI
Drawing Utility is a customizable chart annotation tool designed for trading platforms. It features a rectangular box with five adjustable Fibonacci levels, which can also be customized to user-defined values. The utility is activated by pressing Alt and dragging on the chart. Key functionalities include quick access to Fibonacci retracement levels, marking Fair Value Gaps, measuring price movements, and highlighting Points of Interest. Additionally, it supports flexible use cases for various chart annotations, allowing traders to tailor it to their specific analysis needs.
Profil wskaźnika
Opinie klientów
0.0
Opinie: 0
Opinie klientów
Ten produkt nie ma jeszcze opinii. Wypróbowałeś(-aś) go już? Bądź pierwszy(-a) i powiedz o tym innym!
Dyskusja
Częste pytania
Produkty dostępne za pośrednictwem cTrader Store, w tym boty handlowe, wskaźniki i wtyczki, dostarczane są przez deweloperów zewnętrznych i udostępniane wyłącznie w celach informacyjnych oraz w celu zapewnienia dostępu technicznego. cTrader Store nie jest brokerem i nie zapewnia doradztwa inwestycyjnego, nie udziela spersonalizowanych rekomendacji ani nie gwarantuje przyszłych wyników.
Więcej od tego autora


Cena
15
Sprzedaż
4.65K
Bezpłatne instalacje