
Descrição
Complete suas estratégias com este indicador de sinal👇🏻
https://ctrader.com/pt/products/1560?u=Goulart
✔Características do Indicador
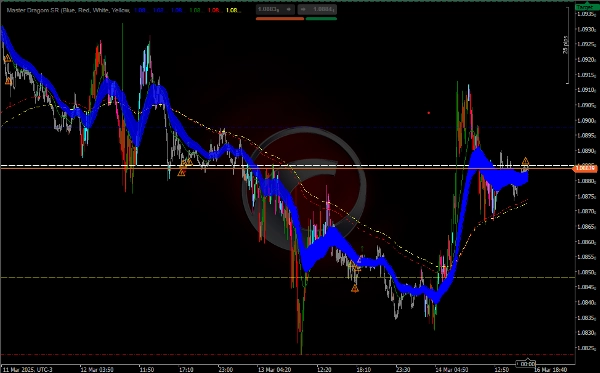
Suporte e Resistência (SR):
O indicador desenha linhas horizontais para níveis diários, semanais e mensais de suporte e resistência.
Você pode ativar ou desativar cada nível (abertura, fechamento, máxima e mínima) conforme necessário.
Médias Móveis Exponenciais (EMA):
O indicador calcula múltiplas EMAs (50, 25, 200 e 233 períodos) para ajudar a identificar tendências e possíveis áreas dinâmicas de suporte/resistência.
As EMAs são plotadas no gráfico em cores diferentes para facilitar a visualização.
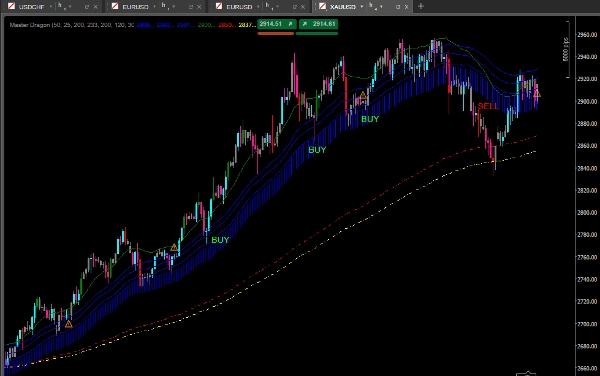
Análise de Volume (PVAVolumeAnalysis):
O indicador analisa o volume para identificar possíveis reversões ou continuações de tendência.
Ele destaca barras com volume acima da média e sinaliza mudanças significativas no volume com ícones (↑, ↓, ⚠️).
Coloração das Barras:
As barras são coloridas com base no volume e na direção do preço (para cima ou para baixo), o que ajuda a identificar a força da tendência.
Análise de Tendência com EMAs:
Use as EMAs para identificar a direção da tendência:
Se o preço estiver acima das EMAs (especialmente as EMAs de 200 e 233), a tendência é de alta.
Se o preço estiver abaixo das EMAs, a tendência é de baixa.
A área entre a EMA 50 Alta e Baixa pode ser usada como uma zona de interesse para possíveis reversões ou continuações.
Análise de Volume:
Observe os ícones e as cores das barras para identificar mudanças no volume:
Volume alto com preço subindo (↑): Confirmação de uma tendência de alta.
Volume alto com preço caindo (↓): Confirmação de uma tendência de baixa.
Volume baixo com preço subindo ou caindo (⚠️): Possível reversão.
Combinando Sinais:
Combine os sinais de volume, EMAs e níveis de SR para tomar decisões de entrada ou saída.
Por exemplo, se o preço estiver próximo a um nível de resistência e o volume estiver diminuindo, pode ser um sinal de reversão.
Estratégia Sugerida
Estratégia de Tendência com Confirmação de Volume
Identifique a Tendência:
Use as EMAs (200 e 233) para determinar a tendência principal.
Se o preço estiver acima das EMAs, considere apenas compras.
Se o preço estiver abaixo das EMAs, considere apenas vendas.
Espere um Pullback:
Espere o preço retornar para uma EMA de período mais curto (50 ou 25) ou para um nível de SR.
Confirme com o Volume:
Verifique se o volume está aumentando na direção da tendência (↑ para compras, ↓ para vendas).
MA localiza tendências, pullback, sinaliza volumes, reversões, suporte e resistência.
Se o volume estiver diminuindo (⚠️), evite entrar ou considere uma reversão.
Entrada:
Compre quando o preço estiver acima das EMAs e próximo a um nível de suporte, com volume confirmando a tendência de alta.
Venda quando o preço estiver abaixo das EMAs e próximo a um nível de resistência, com volume confirmando a tendência de baixa.
Saída:
Use os níveis de SR ou EMAs como alvos ou pontos de saída.
Por exemplo, feche ou venda quando atingir um nível de suporte.
Resumo
Volume analysis is integrated to detect potential trend reversals or continuations by highlighting bars with above-average volume and signaling significant volume changes using icons (↑ for rising volume confirming uptrends, ↓ for falling volume confirming downtrends, and ⚠️ for low volume indicating possible reversals). Bars are color-coded based on volume and price direction to visually represent trend strength.
Traders can combine signals from volume, EMAs, and support/resistance levels to make informed entry and exit decisions. A suggested strategy involves identifying the main trend using the 200 and 233 EMAs, waiting for pullbacks to shorter EMAs or support/resistance levels, and confirming with volume signals before entering trades. Exit points can be set at support/resistance levels or EMA lines. This indicator is suitable for enhancing trend, pullback, volume, reversal, and support/resistance analysis in various trading strategies.
Avaliações de clientes
5 | 100 % | |
4 | 0 % | |
3 | 0 % | |
2 | 0 % | |
1 | 0 % |


