Penerangan
📌 Penerangan untuk Kedai cTrader – Perancis 🇫🇷
🔍 Penunjuk [LDE] OPR & Sesi Pasaran – Visualisasi jelas sesi!
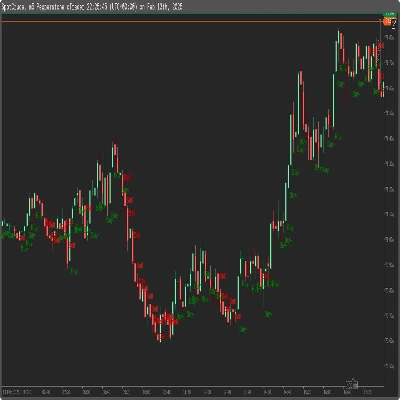
Penunjuk ini menyerlahkan sesi utama pasaran (Tokyo, London, New York) dengan memaparkan segi empat dinamik pada carta anda.
✔ Paparan sesi yang boleh disesuaikan 🏙️
✔ Visualisasi High/Low khusus sesi 📈
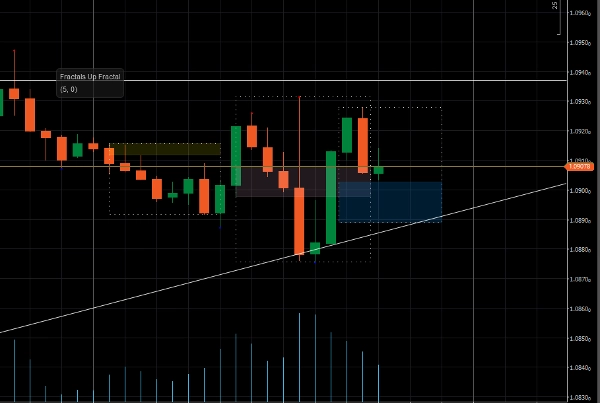
✔ Penyerlahan Julat Harga Buka (OPR) ⏳
✔ Ketelusan boleh laras untuk keterbacaan lebih baik 🎨
✔ Serasi dengan semua aset dan jangka masa ⏰
🔧 Tetapan fleksibel : aktifkan/lumpuhkan setiap sesi, laraskan warna dan sesuaikan paparan H/L untuk setiap sesi.
🚀 Optimumkan dagangan anda dengan mengenal pasti zon pasaran utama dengan pantas!
📌 Description for cTrader Store – English 🇬🇧
🔍 [LDE] OPR & Market Sessions Indicator – Clear visualization of sessions!
This indicator highlights major market sessions (Tokyo, London, New York) by displaying dynamic rectangles on your chart.
✔ Customizable session display 🏙️
✔ Session-specific High/Low visualization 📈
✔ Highlighting of the Open Price Range (OPR) ⏳
✔ Adjustable transparency for better readability 🎨
✔ Compatible with all assets and timeframes ⏰
🔧 Flexible settings: enable/disable each session, adjust colors, and personalize the High/Low display for each session.
🚀 Optimize your trading by identifying key market zones at a glance!
Ringkasan
Ulasan pelanggan
5 | 0 % | |
4 | 100 % | |
3 | 0 % | |
2 | 0 % | |
1 | 0 % |