
설명
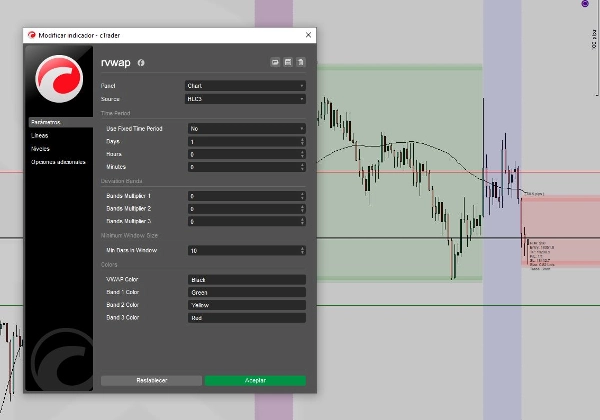
이 cTrader용 롤링 VWAP(거래량 가중 평균 가격) 지표는 트레이더가 동적 또는 고정된 기간 동안 VWAP를 시각화할 수 있도록 합니다. 일, 시간, 분 단위로 시간 창을 사용자 지정할 수 있으며, 현재 차트 시간 프레임에 따라 지표가 자동으로 조정되도록 할 수도 있습니다. 소스 가격은 종가, 시가, 고가, 저가, HL2, HLC3, OHLC4 등의 옵션에서 선택할 수 있습니다. VWAP 위아래로 최대 세 개의 표준 편차 밴드를 포함하여 잠재적인 지지 및 저항 구역을 식별할 수 있습니다. 시간 창이 짧을 때도 신뢰할 수 있는 계산을 보장하기 위해 최소 바 수를 설정할 수도 있습니다. 동적 VWAP 기반 신호와 합류 구역을 찾는 당일 및 스윙 트레이더에게 이상적입니다. 각 선에 대한 완전한 색상 사용자 지정을 포함합니다. 정밀도, 성능 및 최대 유연성을 위해 제작되었습니다.
요약
AI 요약
The rvwap v1 is a Rolling VWAP (Volume Weighted Average Price) indicator designed for the cTrader platform. It enables traders to visualize VWAP over either a dynamic or fixed time period, with customizable time windows specified in days, hours, and minutes, or automatically adjusted to the chart's timeframe. Users can select the source price from multiple options including Close, Open, High, Low, HL2, HLC3, and OHLC4. The indicator features up to three standard deviation bands above and below the VWAP, which help identify potential support and resistance zones. A minimum bar count can be set to ensure calculation reliability for short time windows. The tool supports full color customization for each line, enhancing visual clarity. It is suitable for intraday and swing traders seeking flexible, precise VWAP-based analysis across various markets such as Forex, indices, commodities, stocks, and cryptocurrencies.
지표 프로필
고객 리뷰
4.6
리뷰: 3
5 | 67 % | |
4 | 33 % | |
3 | 0 % | |
2 | 0 % | |
1 | 0 % |
고객 리뷰
April 30, 2025
The first thing that worked was the chart feels less crowded, and a small account test feels safer.
April 30, 2025
April 29, 2025
상담
자주 묻는 질문(FAQ)
BTCUSD
Forex
Indices
EURUSD
Commodities
GBPUSD
NZDUSD
Prop
Scalping
Crypto
Stocks
XAUUSD
NAS100
USDJPY
VWAP
트레이딩 봇, 지표, 플러그인 등 cTrader Store에서 제공되는 상품은 제3자 개발자에 의해 제공되며, 이는 단순히 정보 및 기술적 접근을 목적으로 제공된 것입니다. cTrader Store는 중개인이 아니며, 투자 조언, 개인별 추천 또는 향후 성과에 대한 어떠한 보장도 제공하지 않습니다.


가격
가입일 13/01/2025
2
판매