
説明
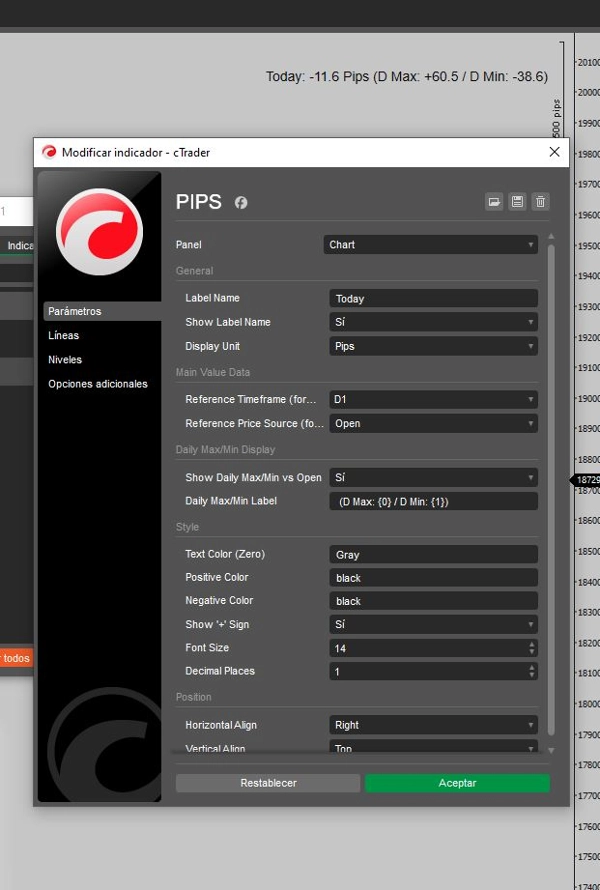
このスクリプトは、主要な日次レベルに関連した価格動向のリアルタイム分析を求めるトレーダー向けに設計されています。現在の価格と日次の高値、安値、始値との間のピップ距離を計算し、チャート上に表示します。
主な特徴:
- リアルタイムデータ: 現在の価格から日次の高値、安値、始値までのリアルタイムのピップ距離を提供します。
- 視覚的明瞭さ: 不要なチャートの混雑を排除し、クリーンでミニマリストな表示を提供します。
- 多用途性: スキャルパー、デイトレーダー、スイングトレーダーに最適で、重要な価格レベルでの意思決定を強化します。
- 効率的なパフォーマンス: 軽量で高速実行に最適化されており、トレーディングワークフローにスムーズに統合されます。
利点:
- 情報に基づく意思決定: 主要な日次レベルに対する市場の位置を迅速に評価します。
- 時間節約: 複数のツールを操作することなく、重要な価格データに即座にアクセスできます。
- カスタマイズ可能: 価格レベルを追跡するための個別で邪魔にならない方法を求めるトレーダーに理想的です。
概要
AIによる概要
Pips V4Final is a trading indicator that provides real-time analysis of price action relative to key daily levels. It calculates and displays the pip distance between the current price and the daily high, low, and open directly on the chart. The indicator features a clean, minimalist interface designed to reduce chart clutter, making it suitable for scalpers, day traders, and swing traders. It is lightweight and optimized for fast execution, allowing seamless integration into various trading workflows. Users can quickly assess market positioning at critical price points, saving time by accessing essential price data instantly. The tool is customizable, offering a non-intrusive way to monitor important daily price levels for informed decision-making.
インジケーターのプロフィール
カスタマーレビュー
4.5
レビュー: 2
5 | 50 % | |
4 | 50 % | |
3 | 0 % | |
2 | 0 % | |
1 | 0 % |
ディスカッション
よくあるご質問
cTrader Storeで入手可能な取引ボット、インジケーター、プラグインなどの商品は、第三者の開発者が提供するものであり、情報と技術の取得のみを目的としてご利用いただけます。cTrader Storeはブローカーではなく、投資助言や個人的な推奨を行うことも、将来のパフォーマンスを保証することもありません。
この作成者の他の商品


価格
登録日 13/01/2025
2
販売