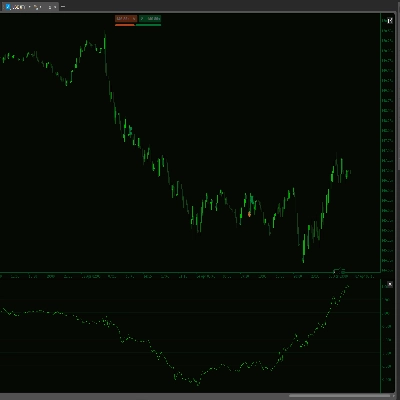
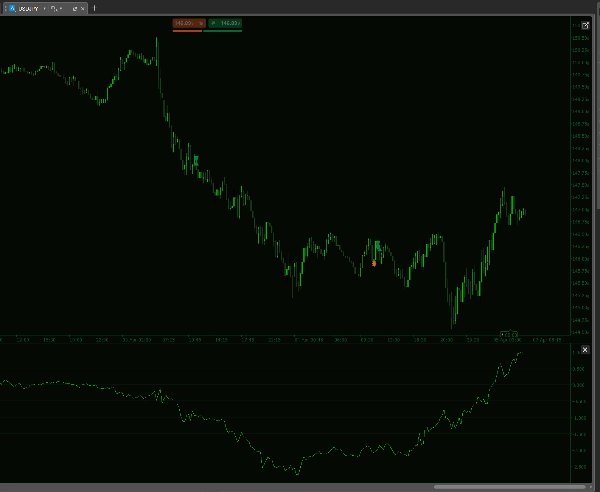
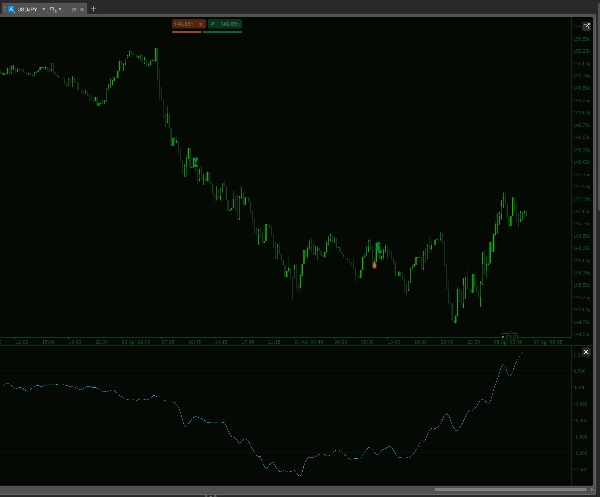
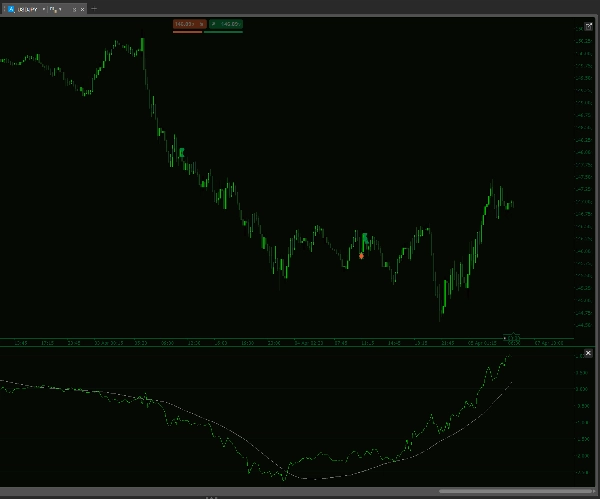
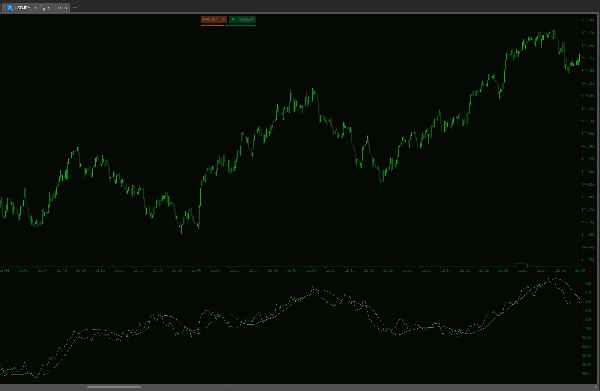
Wskaźnik
Indices
Forex
EURUSD
USDJPY
DXY w HMA
Logo „DXY w HMA”
03/09/2025
60
Desktop
Przesłany obraz „DXY w HMA”Przesłany obraz „DXY w HMA”Przesłany obraz „DXY w HMA”Przesłany obraz „DXY w HMA”

Elevate your trading strategy with the Historical DXY HMA Indicator—a cutting-edge cTrader tool engineered for precision and performance. This advanced indicator calculates a custom U.S. Dollar Index by combining the weighted percentage changes of six key currency pairs, providing you with a dynamic and reliable market gauge.

Key Features:

  • Custom DXY Calculation: Integrates six major USD pairs (EURUSD, USDJPY, GBPUSD, USDCAD, USDCHF, USDSEK) with configurable weights for a finely tuned index.
  • Dual Hull Moving Averages: Employs both short- and long-period Hull MAs to offer a clear picture of market trends and momentum.
  • Slope Smoothing: Enhances trend detection with a smoothed slope HMA, giving you an edge in identifying market reversals.
  • Robust Data Handling: Seamlessly syncs with your cTrader platform, ensuring accurate real-time analysis even when dealing with varying data sources.
  • Customizable Parameters: Fine-tune lookback counts and moving average periods to perfectly match your trading style and market conditions.

Designed with the modern trader in mind, the Historical DXY HMA Indicator simplifies complex market data into actionable insights, enabling you to make smarter, more confident trading decisions. Experience the next level of market analysis!


--------------------------

Please feel free to check out my other indicators!

https://ctrader.com/products/1181

https://ctrader.com/products/1182

https://ctrader.com/products/1180

https://ctrader.com/products/1015

https://ctrader.com/products/555

https://ctrader.com/products/553

https://ctrader.com/products/554

https://ctrader.com/products/552

https://ctrader.com/products/557

https://ctrader.com/products/845

https://ctrader.com/products/848

https://ctrader.com/products/847

https://ctrader.com/products/846

https://ctrader.com/products/551

https://ctrader.com/products/574

https://ctrader.com/products/573

https://ctrader.com/products/556

https://ctrader.com/products/558

https://ctrader.com/products/559

https://ctrader.com/products/560


0.0
Opinie: 0
Opinie klientów
Ten produkt nie ma jeszcze opinii. Wypróbowałeś(-aś) go już? Bądź pierwszy(-a) i powiedz o tym innym!
Więcej od tego autora
Market Sessions - Free
Track major trading sessions (Tokyo, London, New York) with customizable colors and visual sessions on your chart.
Supply Demand V1-Premium
Auto-detect supply & demand zones, remove broken levels, and trade smarter with real-time alerts. Precision made simple.
Supply Demand - BasicV1
Supply and demand zones. They're important. Here's a free version to get you started!
MTF Candle Window - On Chart
The Multi-Timeframe Candle Indicator displays candles from multiple timeframes in one window, enhancing market analysis!
Market Sessions V2_NSC
Market Session V2: Full Control. colors, history, session/text toggles, font size. Elevate your strategy!
Volume Profile Triple Line - POC Median Mode
The Advanced Volume Profile Indicator calculates POC, Median, and Mode, revealing key price levels for smarter trading.
VWAP - London Open
VWAP Set to London Open
Market Session V3_NSC
Version 3: Full control of session display including start and end times of all 3 sessions!
VWAP Tokyo Open
VWAP Set to Tokyo Open
Supply Demand Premium V2_NSC
The long awaited new and improved Supply Demand Premium V2 indicator. Unlock greater trading opportunities now!
Wskaźnik
Indices
Forex
EURUSD
+2
US Dollar Index
US Dollar Index
MTF Candle Countdown
Stay ahead with a real-time countdown to candle closes on all key timeframes: 5m, 15m, 30m, 1H, 4H, and Daily.
Open Trade PipsV1
This indicator tracks the unrealised amount of pips in your open positions.
Wskaźnik
Signal
USDJPY
On Balance Volume USD - Combined
See USD demand in one line—Composite OBV fuses six major FX pairs into a clear momentum gauge.
Open Trade ProfitV1
A simple indicator that tracks the value of your open trades in pips.
Wskaźnik
Indices
Commodities
CCI - With Arrows and 40 80 EMA Logic_noSourceCode
The Advanced CCI & EMA Indicator combines the CCI with 40 & 80 EMA logic to generate precise arrows signaling direction
Wskaźnik
Forex
Signal
USDJPY
Yen Strength - Line Momentum
Single-line JPY Strength Indicator: Track yen momentum swiftly across key pairs—achieve clarity in your forex trades!
Commodity Channel Index Smoothed w Alerts_NSC
Smoothed CCI alerts! Audio & arrow signals for +/-100 crosses. Custom sounds & arrow filters. Precision trading!
Możesz także polubić
Wskaźnik
RSI
Breakout
XAUUSD
+12
Stop Loss Professional
Stop Loss Pro – Precision Risk Management for Every Trader
Area of Interest
Area of Interest with the power of AI to detect the market interest.
Wskaźnik
NAS100
NZDUSD
XAUUSD
+15
SuperTrend from TradingView
Get the exact SuperTrend experience from TV, now perfectly rebuilt for cTrader
Za darmo
BarCount
Bar count
Wskaźnik
RSI
XAUUSD
Breakout
+4
ICT Power of 3
🎯 Auto-plots key zones (Accumulation, Manipulation, Distribution) . Reveals institutional traps & trends.
Wskaźnik
Indices
RSI
Stocks
+3
FiboTrend-Pro
😎Read the description before purchasing💩
BWMFI_Visual
BW_MFI Vizual colors bars
Wskaźnik
Indices
Breakout
Prop
+7
NTNPICLL
NTNPICLL is a tool to check the best trading hours for the assets and also includes the highest and lowest point
Wskaźnik
RSI
Breakout
XAUUSD
+13
Fear & Greed Index
Fear & Greed Index: 4 configurable components (momentum, volatility, strength, pattern) with 6 calculation methods each
VegaXLR - Fibonacci Bands
Customizable Dynamic Fibonacci Channels and Smart Alerts
Wskaźnik
Prop
ATR
ADT_bigCandles
Outside Candle Detector: Highlights major candles/zones with ATR filter & pattern labels. By Avydel Talbo, prop trader.
Wskaźnik
Commodities
Forex
Compra e Venda
Indicador Compra e Venda é um rastreador de tendência.
VegaXLR - Candlestick Patterns Pro
Identify 34 candlestick patterns, track trends across timeframes, and get instant alerts with this powerful trading tool
Renko Line Chart
Smart Signal Reversal Trend + Patterns
Volume-Powered Market Flow Projector
Project market behavior by integrating price and volume data across multiple time dimensions
Buy and sell indicator
Buy and Sell Signals
EURUSD Breakout Indicator
Breakout Multi-Timeframe Strategy Indicator
Wskaźnik
Breakout
3 Bar Triangle by Linda Raschke
3 bar triangle = high below 2 day high, low above 2 day low