
Opis
Trailing Smart Algorithm
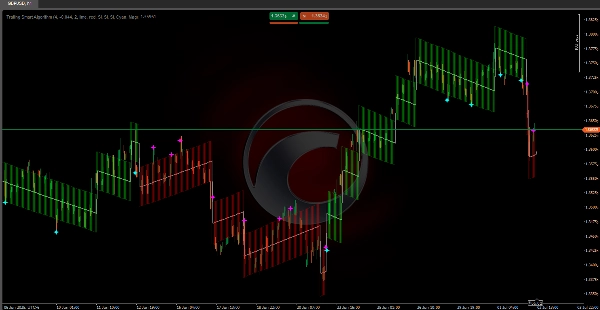
https://chartshots.spotware.com/c/69f0f1d89000b
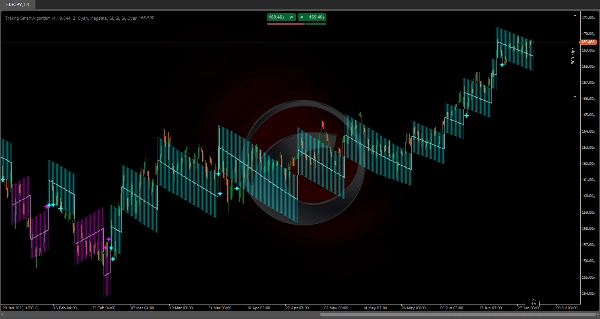
Zawiera algorytmy matematyczne 🧠 specjalnie zaprojektowane do konsekwentnego śledzenia ceny w dowolnych warunkach rynkowych 🌐.
Jego struktura obliczeniowa zapewnia, że linia trendu zawsze pozostaje zsynchronizowana z ruchami cen, unikając typowego opóźnienia tradycyjnych wskaźników ⏳.
W przeciwieństwie do konwencjonalnych algorytmów, system ten wykorzystuje precyzyjne pomiary zmienności 📊 i stosuje automatyczne dostosowania ⚙️, które gwarantują optymalne śledzenie. Jego wewnętrzne obliczenia są zaprojektowane tak, aby dostarczać dokładne odwzorowanie kierunku rynku, utrzymując precyzję zarówno podczas szybkich ruchów ⚡, jak i stopniowego rozwoju trendu 🕊️.
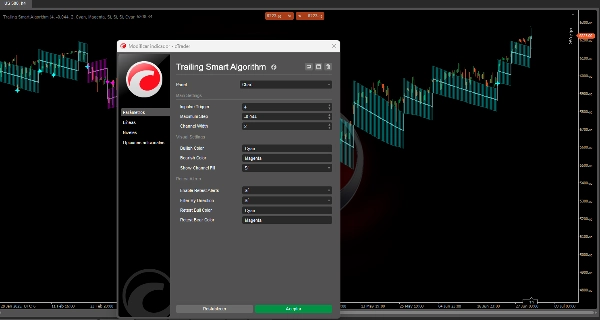
https://chartshots.spotware.com/c/69f0f218591b0
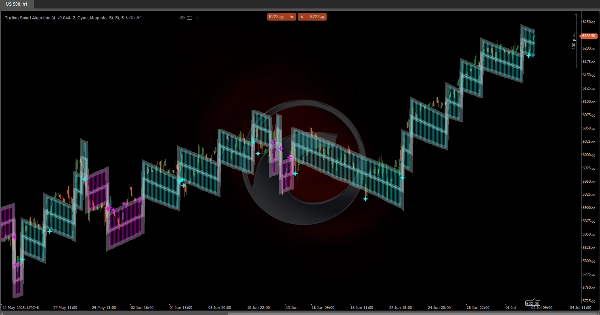
💡 Jak to działa?
Wskaźnik działa za pomocą adaptacyjnego systemu kroków, który porusza się w kierunku dominującego trendu.
Opiera się na trzech głównych komponentach:
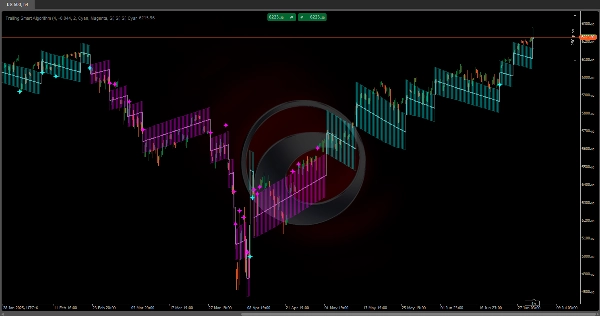
https://chartshots.spotware.com/c/69f0f2b19e4d3
1️⃣ Wykrywanie zmiany trendu
System nieustannie monitoruje cenę, aby wykryć znaczące ruchy przekraczające określony próg (Impulse Trigger 🎯).
Gdy cena oddala się wystarczająco od obecnej linii trendu, wskaźnik rozpoznaje potencjalną zmianę kierunku i przesuwa swoją główną linię.
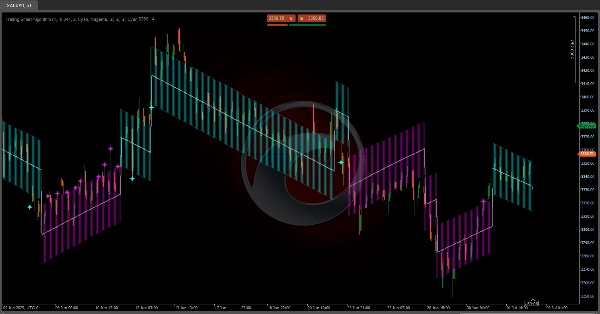
2️⃣ Dynamiczne podążanie
Po ustaleniu kierunku, linia trendu przesuwa się krok po kroku 🪜 w tym samym kierunku co rynek.
Każdy krok jest obliczany na podstawie aktualnej zmienności (ATR 📈):
• W bardziej zmiennych rynkach kroki są większe 🌊
• W spokojniejszych rynkach kroki są mniejsze 🌿
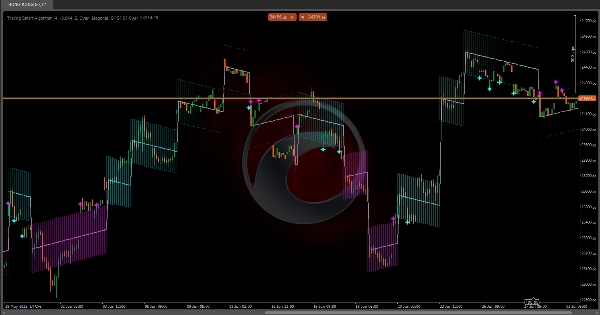
3️⃣ Kanał zmienności
Wokół głównej linii tworzy się kanał (górne i dolne pasma) reprezentujący normalną strefę zmienności 📉📈.
Ten kanał pomaga zidentyfikować, czy cena zachowuje się w normalnych parametrach, czy wykonuje ekstremalne ruchy 🚨.
📏 Kanał zmienności
• Górne pasmo: Górna granica kanału zmienności
• Dolne pasmo: Dolna granica kanału zmienności
✨ Sygnały retestu
• Cyjanowe gwiazdy 🌟: Cena dotyka lub przekracza dolne pasmo podczas trend wzrostowego
• Magenta gwiazdy ⭐: Cena dotyka lub przekracza górne pasmo podczas trend spadkowego
⚙️ Ustawienia parametrów
🔹 Główne parametry
Impulse Trigger (wartość domyślna: 4)
Co robi?
Określa czułość wykrywania zmian trendu. To mnożnik ATR definiujący, o ile cena musi się przesunąć, aby wywołać zmianę kierunku.
Wpływ przy zmianie:
• Wyższe wartości (5–8):
- Większa odporność na zmiany trendu 🛡️
- Mniej fałszywych sygnałów
- Wolniejsza reakcja na rzeczywiste zmiany
• Niższe wartości (2–3):
- Wyższa czułość 🎯
- Szybsza reakcja
- Większe prawdopodobieństwo fałszywych sygnałów na rynkach bocznych
Maksymalny krok (wartość domyślna: -0.044)
Co robi?
Ogranicza maksymalny rozmiar każdego kroku, jaki może wykonać linia trendu. To wartość ujemna działająca jako limit.
Wpływ przy zmianie:
• Mniej ujemne (-0.020 do -0.030):
- Większe kroki 🚀
- Bardziej agresywne śledzenie trendu
• Bardziej ujemne (-0.050 do -0.080):
- Mniejsze, bardziej stopniowe kroki 🌱
- Bardziej konserwatywne podążanie
Szerokość kanału (wartość domyślna: 2)
Co robi?
Określa szerokość kanału zmienności wokół głównej linii.
Wpływ przy zmianie:
• Wyższe wartości (3–4):
- Szerszy kanał 🟢
- Mniej sygnałów retestu
- Większa tolerancja na zmienność
• Niższe wartości (1–1.5):
- Węższy kanał 🔴
- Więcej sygnałów retestu
- Większa czułość na szumy
🎨 Parametry wizualne
Kolor byczy / Kolor niedźwiedzi
Określają kolory dla trendów wzrostowych i spadkowych odpowiednio.
Pokaż wypełnienie kanału
Włącz lub wyłącz wizualne wypełnienie kanału zmienności 🌈.
🔔 Ustawienia retestu
Włącz alerty retestu
Przełącz sygnały retestu, gdy cena dotyka pasm kanału.
Filtruj według kierunku
Po włączeniu pokazuje tylko sygnały retestu zgodne z aktualnym trendem:
• W trendu wzrostowym: Tylko sygnały na dolnym paśmie
• W trendu spadkowym: Tylko sygnały na górnym paśmie
🌟 Podsumowanie sygnałów retestu
• Cyjanowa gwiazda na dolnym paśmie: Potencjalny byczy odbicie od dynamicznego wsparcia ✅
• Magenta gwiazda na górnym paśmie: Potencjalny niedźwiedzi odbicie od dynamicznej oporu ❌
Podsumowanie
Opinie klientów
5 | 100 % | |
4 | 0 % | |
3 | 0 % | |
2 | 0 % | |
1 | 0 % |


