
설명
📜 설명
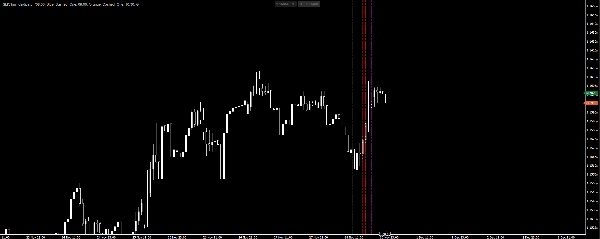
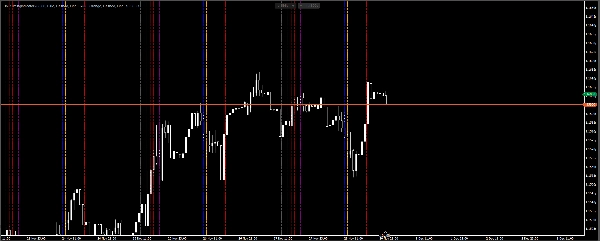
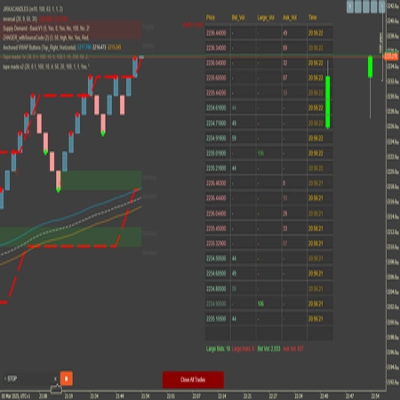
SMC 타이밍 인디케이터는 트레이더가 일중 타이밍과 시장 세션 구조를 시각화할 수 있도록 도와주는 cTrader 플랫폼용 맞춤형 도구입니다. 특히 스마트 머니 컨셉(SMC)과 ICT 전략을 적용하는 트레이더를 위해 설계되었으며, 정확한 타이밍이 매우 중요합니다.
✨ 주요 기능
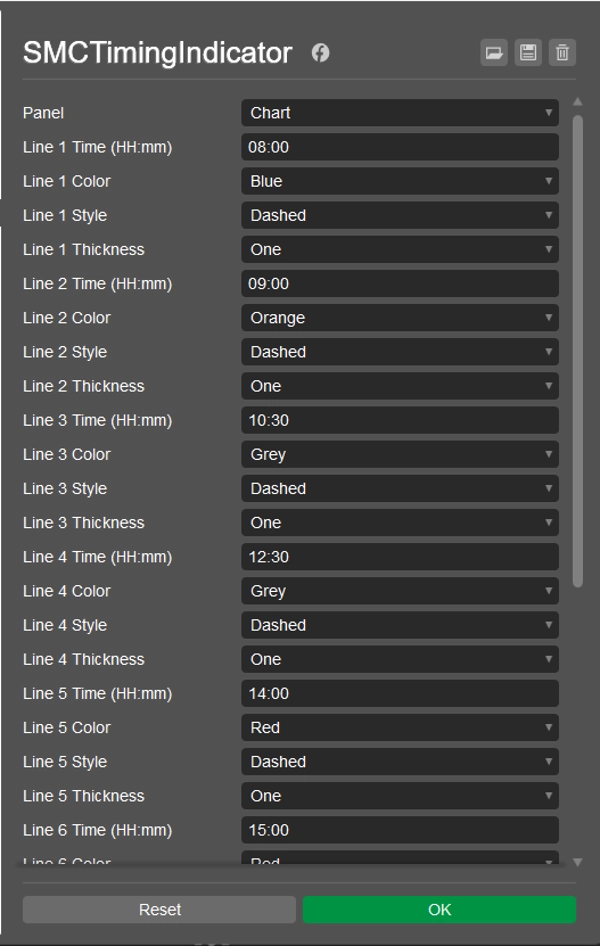
- 하루에 최대 8개의 설정 가능한 수직선 지원
- 각 선에 대해 시간, 색상, 스타일, 두께 완전 커스터마이징 가능
- 이전 거래일의 과거 선 표시 옵션 제공
- UTC 오프셋 매개변수로 유연한 시간대 조정 가능
- enum, 헬퍼, 서비스 등을 활용한 깔끔하고 모듈화된 아키텍처
- 오픈 소스 및 무료로 사용 및 공유 가능
⚙️ 매개변수
각 선은 고유한 매개변수 세트(시간, 색상, 스타일, 두께)를 가지고 있어, 트레이딩 요구에 맞게 인디케이터를 조정할 수 있습니다.
📈 사용법
- 인디케이터를 cTrader Automate에 설치합니다.
- 선의 시간과 스타일을 설정합니다.
- 로컬 시간대 또는 브로커 서버 시간에 맞게 UTC 오프셋을 조정합니다.
- 과거 세션 타이밍을 시각화하기 위해 과거 선 표시를 활성화합니다.
📦 라이선스
MIT 라이선스 하에 공개되어 있으며, 자유롭게 사용, 수정 및 배포할 수 있습니다.
요약
AI 요약
SMC Timing Indicator is a customizable indicator for the cTrader platform designed to mark trading sessions with vertical lines. It supports up to eight configurable vertical lines per day, each with adjustable time, color, style, and thickness settings. The indicator includes a UTC offset parameter to align session times with different time zones or broker server times. Users can enable the display of historical session lines to visualize past trading days. The tool is particularly suited for traders using Smart Money Concepts (SMC) and ICT strategies, where precise intraday timing and market session structure visualization are important. It features a modular architecture and is published under the MIT License, allowing free use, modification, and distribution. Installation and configuration are done through cTrader Automate.
지표 프로필
고객 리뷰
0.0
리뷰: 0
고객 리뷰
이 상품에 대한 리뷰가 아직 없습니다. 이미 사용해 보셨나요? 다른 사람들에게 가장 먼저 소개해 주세요!
상담
자주 묻는 질문(FAQ)
Forex
EURUSD
SMC
트레이딩 봇, 지표, 플러그인 등 cTrader Store에서 제공되는 상품은 제3자 개발자에 의해 제공되며, 이는 단순히 정보 및 기술적 접근을 목적으로 제공된 것입니다. cTrader Store는 중개인이 아니며, 투자 조언, 개인별 추천 또는 향후 성과에 대한 어떠한 보장도 제공하지 않습니다.
이 작성자의 상품 더 보기


가격
가입일 24/09/2025
366
무료 설치