
AsiaSession
Indicatore
226 download
Versione 1.0, Dec 2025
Windows, Mac
Descrizione
📜 Descrizione
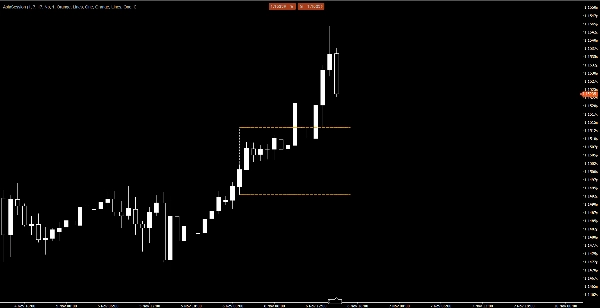
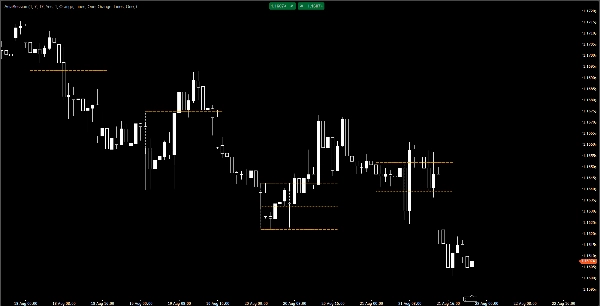
AsiaSession Indicator è uno strumento personalizzato per la piattaforma cTrader che evidenzia l'intervallo della sessione di trading asiatica. Disegna una casella completa della sessione con confini verticali per gli orari di inizio e fine, e linee orizzontali per i livelli massimo, minimo e medio. Questo lo rende particolarmente utile per i trader che applicano Smart Money Concepts (SMC) e strategie ICT, dove i livelli della sessione asiatica spesso fungono da zone di liquidità.
✨ Caratteristiche principali
- Disegna una casella completa della sessione:
-
- Linea sinistra (inizio sessione)
- Linea destra (fine sessione)
- Linea superiore (massimo Asia)
- Linea inferiore (minimo Asia)
- Linea centrale (medio Asia)
- Estende le linee massimo/minimo/medio nel futuro fino a un orario definito dall'utente
- Configurabili colori, stili e spessore per ogni linea
- Opzione per mostrare solo il giorno corrente o includere sessioni storiche
- Parametro integrato di offset UTC per le regolazioni del fuso orario
- Salta automaticamente i fine settimana per evitare sessioni false
- Architettura pulita e orientata agli oggetti con enum, helper, modelli e servizi
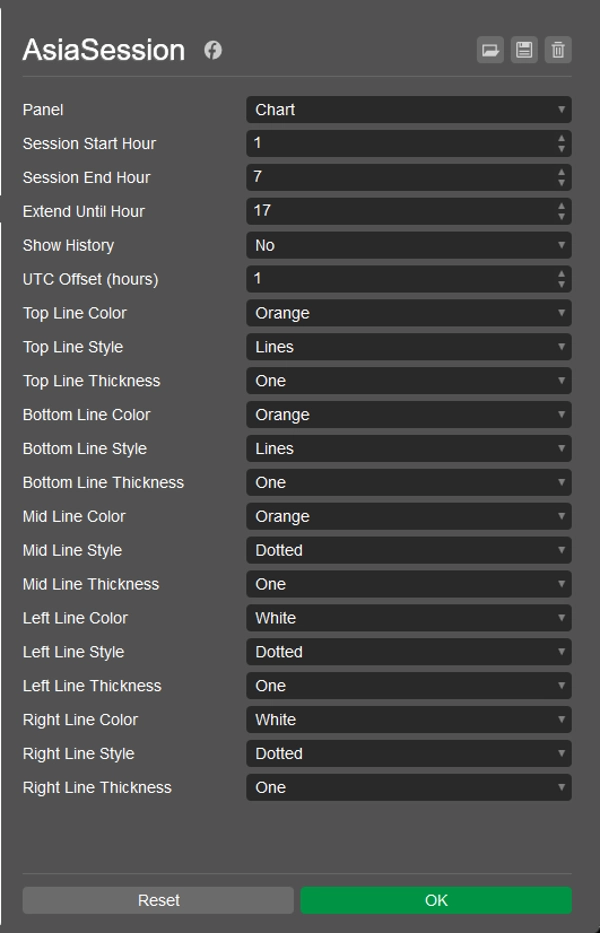
⚙️ Parametri
- Ora di inizio / Ora di fine sessione – definisce i confini della sessione asiatica
- Estendi fino all'ora – controlla per quanto tempo le linee si estendono nel futuro
- Mostra cronologia – attiva/disattiva le caselle delle sessioni storiche
- Offset UTC – regola al tuo fuso orario locale o all'orario del server del broker
- Personalizzazione delle linee – imposta colore, stile e spessore per ogni confine
📈 Utilizzo
- Installa l'indicatore in cTrader Automate.
- Applicalo al tuo grafico.
- Regola i parametri per adattarli al tuo fuso orario di trading e alle tue preferenze.
- Abilita Mostra cronologia per visualizzare le sessioni passate.
📦 Licenza
Pubblicato sotto la Licenza MIT – libero da usare, modificare e distribuire.
Riepilogo
Riepilogo AI
AsiaSession is a custom indicator for the cTrader platform designed to visualize the Asian trading session range. It draws a complete session box on the chart, including vertical lines marking the session start and end times, and horizontal lines indicating the session’s high, low, and mid levels. These lines can be extended into the future up to a user-defined time. The indicator supports customizable colors, styles, and thickness for each line, allowing traders to tailor the display to their preferences.
Key parameters include session start and end hours, extension duration for the lines, an option to show historical sessions or only the current day, and a built-in UTC offset for timezone adjustments. The indicator automatically skips weekends to avoid displaying false sessions. Its architecture is object-oriented, facilitating clean and efficient operation.
AsiaSession is particularly useful for traders applying Smart Money Concepts (SMC) and ICT strategies, where Asian session levels often serve as liquidity zones. Installation involves adding the indicator to cTrader Automate and configuring parameters to match the trader’s timezone and preferences. The product is published under the MIT License, permitting free use, modification, and distribution.
Profilo indicatore
Recensioni dei clienti
0.0
Recensioni: 0
Recensioni dei clienti
Questo prodotto non ha ancora ricevuto recensioni. L'hai già provato? Fallo sapere agli altri per primo!
Discussioni
Domande frequenti
Forex
EURUSD
SMC
I prodotti disponibili tramite cTrader Store, inclusi bot di trading, indicatori e plugin, sono forniti da sviluppatori terzi e resi disponibili esclusivamente a scopo informativo e di accesso tecnico. cTrader Store non è un broker e non fornisce consulenze in materia di investimento, raccomandazioni individualizzate o garanzie di risultati futuri.
Altro da questo autore


![Logo di "Gaussian Channel [Iridio Capital]"](https://cdn.ctrader.com/image/webp/7c039209-5573-4a54-a072-f9528b503103_41960)

Prezzo
Da 24/09/2025
369
Installazioni gratuite