
설명
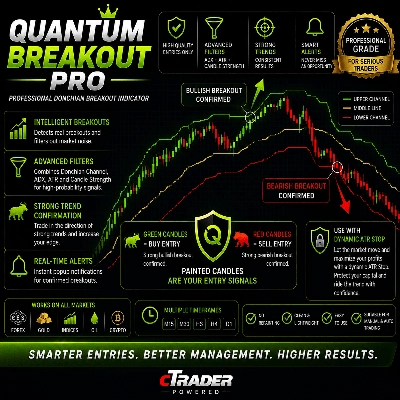
Quantum Breakout Pro는 최대한의 정밀도로 고품질 돌파 신호를 요구하는 트레이더를 위해 제작된 전문 추세 추종 지표입니다.
전통적인 돈치안 지표와 달리, Quantum Breakout Pro는 돈치안 채널, ADX 추세 강도, ATR 변동성 필터, 그리고 캔들 강도 분석을 결합하여 약한 돌파를 걸러내고 가장 높은 확률의 거래 기회만을 강조합니다.
재량권을 가진 트레이더와 자동 거래 시스템 모두를 위해 설계된 Quantum Breakout Pro는 어떤 시장 상황에서도 깔끔하고 객관적이며 신뢰할 수 있는 진입 신호를 제공합니다.
왜 Quantum Breakout Pro인가요?
많은 돌파 지표들은 횡보장 동안 신호를 생성하여 잘못된 진입과 불필요한 손실을 초래합니다.
Quantum Breakout Pro는 신호를 생성하기 전에 여러 전문 등급 필터를 통해 모든 돌파를 확인함으로써 이 문제를 해결하기 위해 개발되었습니다.
그 결과 신호는 적지만 품질은 훨씬 높아집니다.
주요 특징
✔ 전문 돈치안 돌파 시스템
✔ 지능형 ADX 추세 강도 필터
✔ ATR 변동성 확인
✔ 캔들 강도 검증
✔ 자동 매수 및 매도 신호 캔들
✔ 실시간 팝업 알림
✔ 리페인팅 없음
✔ 추세 추종에 최적화됨
✔ 경량 및 빠른 계산
✔ 수동 및 자동 거래에 적합
작동 원리
Quantum Breakout Pro는 돈치안 채널 내 가격 움직임을 지속적으로 모니터링합니다.
다음 모든 조건이 확인된 후에만 신호가 생성됩니다:
• 가격이 돈치안 채널 위 또는 아래로 돌파
• ADX에 따른 강한 시장 추세
• 캔들 크기가 최소 ATR 변동성 요구 사항을 초과
• 캔들이 돌파 방향으로 충분한 강도로 마감
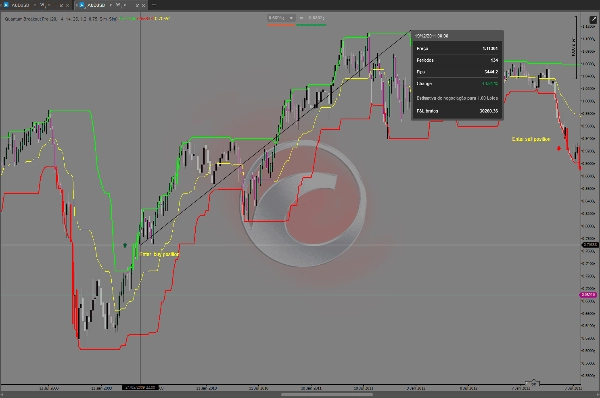
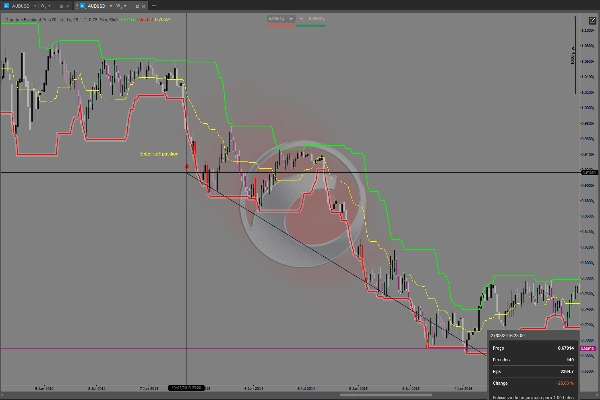
모든 필터가 일치할 때 신호 캔들이 자동으로 강조 표시됩니다.
진입 신호
색깔이 있는 캔들이 거래 진입 신호입니다.
녹색 캔들
녹색 캔들은 강세 돌파를 확인합니다.
이는 매수 거래에 권장되는 진입 지점입니다.
적색 캔들
적색 캔들은 약세 돌파를 확인합니다.
이는 매도 거래에 권장되는 진입 지점입니다.
청산 전략
Quantum Breakout Pro는 특히 고품질 진입을 제공하도록 설계되었습니다.
최적의 거래 관리를 위해 동적 ATR 스톱 또는 변동성 기반 추적 스톱을 사용하는 것을 권장합니다.
이를 통해 트레이더는 다음을 할 수 있습니다:
- 강한 추세에 더 오래 머무르기
- 열린 이익을 자동으로 보호하기
- 이익 거래를 너무 일찍 종료하지 않기
- 변하는 시장 변동성에 적응하기
- 추세 추종 성능 극대화
권장 시장
- 외환
- 금 (XAUUSD)
- 은
- 지수
- 원유
- 암호화폐
- CFD
권장 타임프레임
- M15
- M30
- H1
- H4
- 일간
- 주간
조정 가능한 매개변수
- 돈치안 기간
- ADX 기간
- 최소 ADX
- ATR 기간
- ATR 배수
- 캔들 마감 강도
- 캔들 색상
- 팝업 알림
적합 대상
✔ 추세 트레이더
✔ 스윙 트레이더
✔ 돌파 트레이더
✔ 포지션 트레이더
✔ 알고리즘 트레이딩
✔ 가격 행동 트레이더
장점
- 대부분의 잘못된 돌파 신호 제거
- 다중 레이어 확인 시스템
- 읽기 쉬운 시각적 신호
- 깔끔한 차트 레이아웃
- 전문가 수준의 필터링
- 리페인팅 없음
- 빠른 실행
- 초보자 친화적
- 전문가 수준의 정확도
전문가 추천
최고의 거래 경험을 위해 색깔 있는 캔들을 진입 신호로 사용하고 동적 ATR 스톱으로 포지션을 관리하는 것을 권장합니다.
이 조합은 Quantum Breakout Pro가 높은 확률의 진입을 식별하면서도 시장이 청산 신호를 보낼 때까지 이익 거래를 자연스럽게 유지할 수 있게 합니다.
Quantum Breakout Pro가 다른 점은?
대부분의 돈치안 지표는 모든 돌파를 생성합니다.
Quantum Breakout Pro는 중요한 돌파만 생성합니다.
돈치안 채널 분석과 ADX, ATR, 캔들 강도 확인을 결합하여 더 똑똑하고 깔끔하며 신뢰할 수 있는 돌파 거래 경험을 제공합니다.
Quantum Breakout Pro
더 똑똑하게 거래하세요. 잡음을 걸러내세요. 추세를 포착하세요.
요약
The indicator continuously monitors price action within the Donchian Channel and generates entry signals when all conditions align: a price breakout beyond the channel, a strong market trend per ADX, sufficient candle size relative to ATR volatility, and a candle close confirming breakout direction. Signals appear as colored candles—green for bullish breakouts (buy signals) and red for bearish breakouts (sell signals)—with real-time popup alerts and no repainting.
Quantum Breakout Pro is optimized for trend-following strategies and suitable for manual and automated trading across various markets including Forex, gold (XAUUSD), silver, indices, oil, cryptocurrencies, and CFDs. Recommended timeframes range from 15 minutes to weekly charts. Adjustable parameters include Donchian and ADX periods, ATR settings, candle strength thresholds, and alert options.
For trade management, it is advised to use a dynamic ATR-based trailing stop to maximize trend capture and protect profits. The indicator is designed for trend, swing, breakout, position, algorithmic, and price action traders seeking precise breakout entries with a clean chart layout and fast execution.
!["[Hamster-Coder] Pivot Points MTF" 로고](https://cdn.ctrader.com/image/webp/4c143e5a-309c-40e3-a578-f04d1e133ffa_31159)
















