Opis
Previous HLOC – Inteligentne poziomy wyższych interwałów czasowych dla precyzyjnego handlu
Previous HLOC to profesjonalny wskaźnik wielointerwałowy, który rysuje poziomy wysokiego, niskiego, otwarcia i zamknięcia poprzedniego okresu bezpośrednio na Twoim wykresie z niezrównaną przejrzystością i możliwością dostosowania.
Stworzony dla traderów price-action, skalperów, traderów intraday i swingowych, ten wskaźnik pomaga natychmiast zidentyfikować kluczowe poziomy instytucjonalne, które często pełnią rolę wsparcia, oporu, stref odrzutu i celów płynności.
Dlaczego Previous HLOC?
Rynki konsekwentnie reagują na poziomy z poprzedniego dnia, tygodnia i miesiąca. Instytucje, algorytmy i profesjonalni traderzy uważnie śledzą te poziomy.
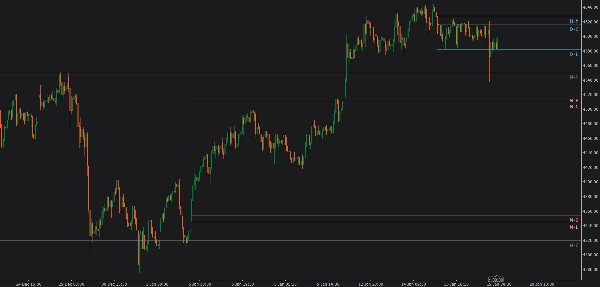
Previous HLOC przenosi te kluczowe ceny na Twój wykres w czysty, wolny od rozproszeń sposób — dzięki czemu nigdy ich nie przegapisz.
Kluczowe funkcje
✅ Poziomy wielointerwałowe
- Wybierz poziomy świec dziennych, tygodniowych, miesięcznych lub godzinowych
- Poziomy pozostają dokładne niezależnie od interwału Twojego wykresu
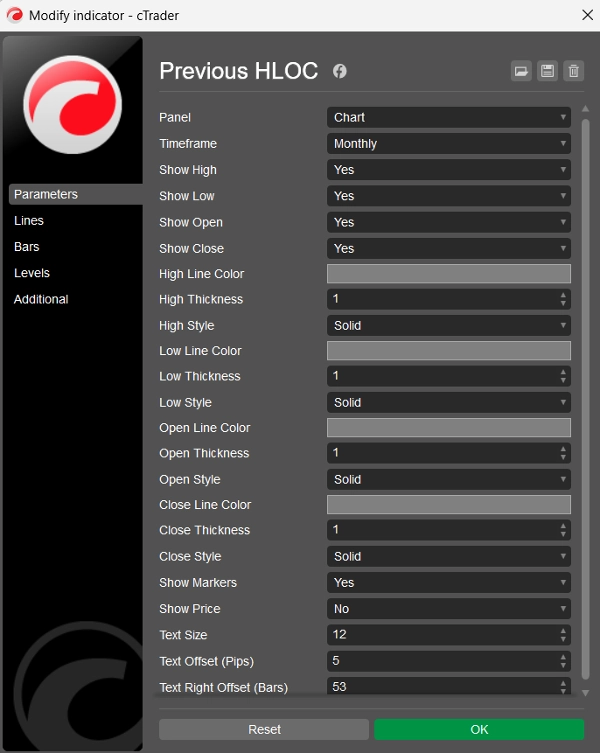
✅ Pełna kontrola HLOC
- Włączaj lub wyłączaj High, Low, Open, Close indywidualnie
- Handluj tylko tym, co jest ważne dla Twojej strategii
✅ Zaawansowane dostosowanie
- Oddzielne kolory, grubość i styl linii dla każdego poziomu
- Czyste markery w czcionce Consolas z regulowaną wielkością tekstu
- Opcjonalny wyświetlacz ceny obok każdego markera
✅ Inteligentne pływające markery
- Markery poruszają się naturalnie wraz z wykresem
- Zawsze pozostają wyrównane do poziomu cenowego podczas przewijania
- Umieszczone po prawej stronie dla lepszej widoczności
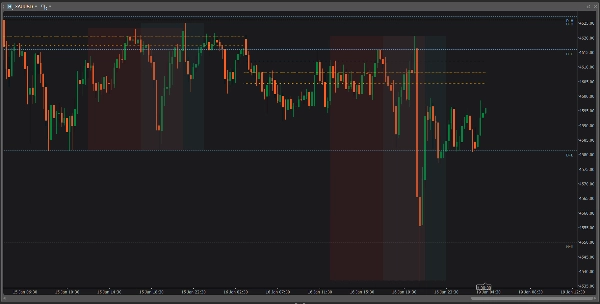
✅ Poziomy prognozowane na przyszłość
- Linie rozciągają się daleko w przyszłość
- Idealne do planowania wejść, wyjść, stop-lossów i poziomów take-profit
🔹 Jak traderzy go używają
📌 Identyfikuj silne wsparcia i opory intraday
📌 Używaj poprzednich poziomów High/Low jako stref skanowania płynności
📌 Handluj wybicia, odrzuty i retesty
📌 Dopasuj wejścia do biasu wyższego interwału czasowego
📌 Popraw precyzję stosunku ryzyka do zysku
🔹 Dla kogo jest ten wskaźnik?
✔ Traderzy Forex
✔ Traderzy indeksów i surowców
✔ Skalperzy i traderzy dzienni
✔ Traderzy swingowi
✔ Traderzy price-action i SMC
🔹 Czysty. Szybki. Niezawodny.
- Brak przemalowań
- Brak opóźnień
- Brak bałaganu
- Działa na wszystkich symbolach i wszystkich interwałach czasowych
🔹 Podsumowanie
Previous HLOC to nie tylko kolejny wskaźnik poziomów — to profesjonalne narzędzie handlowe, które pomaga handlować z kontekstem, strukturą i pewnością siebie.
Jeśli handlujesz wokół poziomów poprzedniej sesji, ten wskaźnik powinien znaleźć się na Twoim wykresie.
Podsumowanie
Opinie klientów
5 | 100 % | |
4 | 0 % | |
3 | 0 % | |
2 | 0 % | |
1 | 0 % |


