
Opis
Market Structure Pro – Linie trendu, strefy i inteligentne wejścia
Market Structure Pro to kompletne narzędzie do analizy price-action, które automatycznie mapuje strukturę ruchów rynkowych, kluczowe wsparcia/opory, prawdziwe linie trendu oraz strefy HH/LL — a następnie opcjonalnie podkreśla wysokoprawdopodobne wejścia po cofnięciu z wbudowaną logiką potwierdzenia.
Zamiast rysować wszystko ręcznie, wskaźnik ciągle skanuje wykres w tle i na bieżąco aktualizuje strukturę, strefy oraz sygnały w czasie rzeczywistym.
Co robi ten wskaźnik
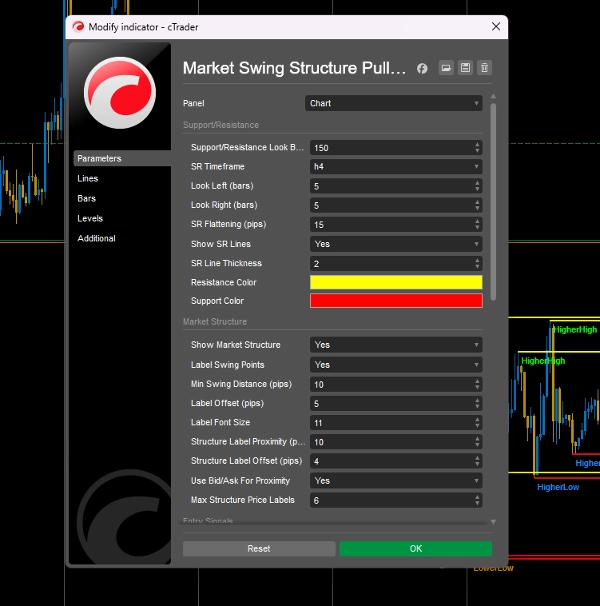
- Automatyczne wsparcia i opory
-
- Wykrywa lokalne maksima/minima w określonym zakresie cofania.
- Wygładza pobliskie poziomy do czystszych stref, używając tolerancji w pipsach.
- Rysuje interaktywne linie wsparcia/oporu na dowolnym wybranym interwale czasowym (np. 4H SR na wejściach M15).
- W pełni konfigurowalna grubość i kolory dla wsparć i oporów.
- Prawdziwe zewnętrzne linie trendu
-
- Buduje rosnące/opadające linie wsparcia i oporu z potwierdzonych punktów zwrotnych.
- Kontrole ograniczające liczbę linii trendu na kierunek oraz ich przedłużanie w przyszłość.
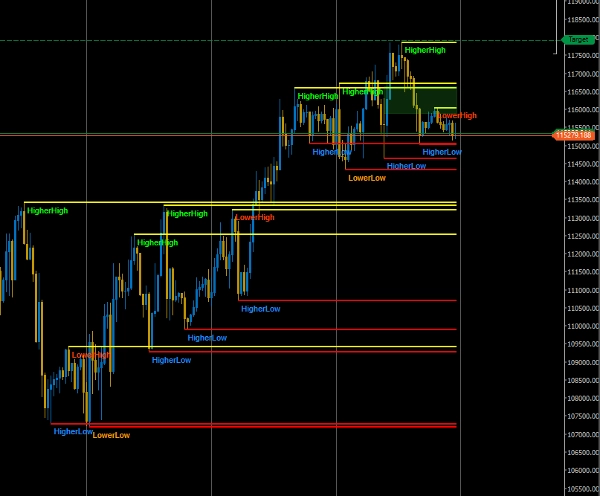
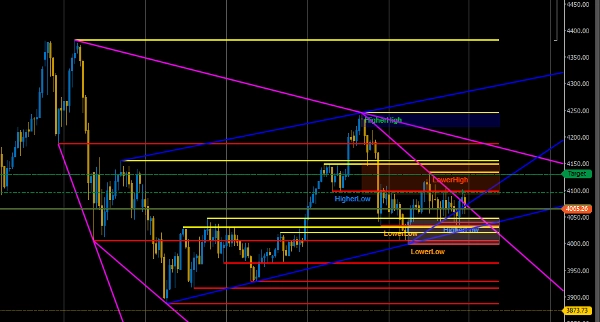
- Mapowanie struktury rynku (HH, HL, LH, LL)
-
- Oznacza na wykresie wyższe maksima, wyższe minima, niższe maksima i niższe minima.
- Regulowana minimalna odległość ruchu (w pipsach) w celu eliminacji szumu rynkowego.
- Ogranicza liczbę aktywnych etykiet, aby wykres pozostał czytelny.
- Na żywo pokazuje tekst „Aktualny trend” (trend wzrostowy / spadkowy / boczny, z notatkami o odwróceniu).
- Wbudowany komunikat „Prognoza następnej struktury”, dający kontekst kierunkowy.
- Strefy świec źródłowych HH/LL
-
- Automatycznie rysuje strefy z ostatnich świec źródłowych wyższego maksimum i niższego minimum.
- Trzy tryby stref:
-
- Pełna świeca (maksimum ↔ minimum)
- Tylko korpus (zakres otwarcia/zamknięcia)
- Tylko knot (górny knot dla HH, dolny knot dla LL)
- Dopełnienie strefy (w pipsach), przezroczystość, kolor dla stref długich/krótkich oraz opcja przedłużenia stref do aktualnego słupka.
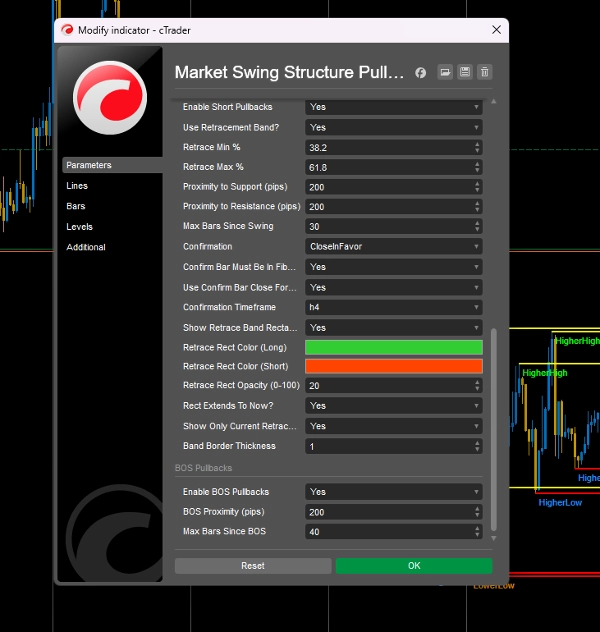
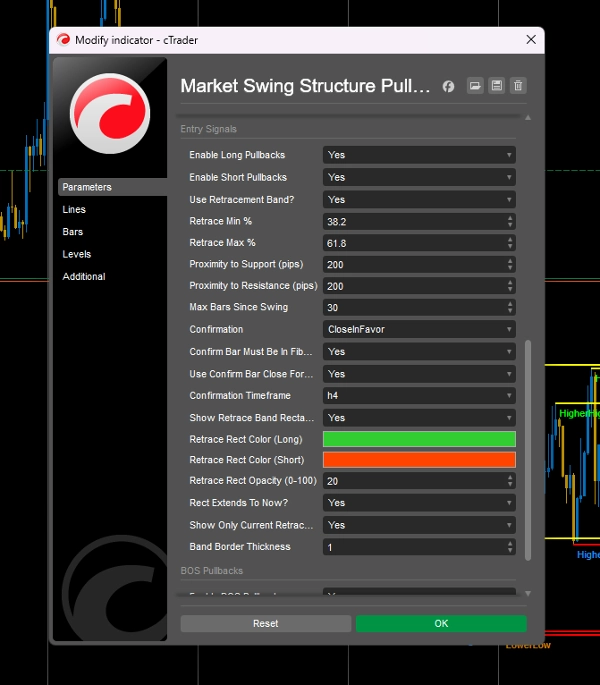
- Inteligentne sygnały wejścia (opcjonalne)
-
- Główny przełącznik do włączania/wyłączania wszystkich sygnałów wejścia.
- Wejścia po cofnięciu ruchu:
-
- Używa najnowszej nogi impulsu (HH–HL lub LH–LL).
- Buduje pasmo cofnięcia w stylu Fibonacciego (np. 38,2–61,8%) dla kupna/sprzedaży.
- Sprawdza bliskość punktów zwrotnych i poziomów wsparcia/oporu.
- Ogranicza, ile słupków po ruchu sygnał jest nadal ważny.
- Cofnięcia po przełamaniu struktury (BOS):
-
- Wykrywa BOS przez kluczowe przełamania LH/HL.
- Szukaj retestów poziomu BOS i pobliskich wsparć/oporów.
- Używa oddzielnych filtrów bliskości i „słupków od BOS”.
- Silnik potwierdzeń
-
- Wiele trybów potwierdzeń dla wejść:
-
- Tylko zamknięcie na korzyść
- Tylko świeca objęcia
- Zamknięcie + objęcie
- Brak (surowe sygnały)
- Opcjonalny wymóg, aby świeca potwierdzająca była również wewnątrz pasma cofnięcia.
- Oddzielny interwał potwierdzenia (np. potwierdzenie na H4 podczas handlu na M15).
- Możesz wybrać użycie zamknięcia świecy potwierdzającej jako faktycznej ceny/czasu sygnału.
- Kontrole wizualne i wydajności
-
- Regulowane przesunięcia etykiet, rozmiar czcionki i maksymalna liczba etykiet struktury.
- Przezroczystość prostokąta, grubość obramowania i zachowanie „przedłuż do teraz” dla pasm cofnięcia i stref.
- Aktualizacje oparte na timerze, aby utrzymać efektywność obliczeń nawet na niższych interwałach.
Idealne dla
- Traderów price-action, którzy polegają na strukturze rynku (HH/HL/LH/LL).
- Traderów swingowych i intraday, którzy chcą mieć wsparcia/opory i linie trendu z wyższych interwałów widoczne na wykresie wejścia.
- Traderów szukających wejść po cofnięciu oparte na regułach wokół kluczowej struktury, stref i poziomów BOS z jasnymi potwierdzeniami.
Jak używać
- Wybierz interwał czasowy SR (np. H4) i zakres cofania.
- Włącz linie trendu i dostosuj, czy chcesz je przedłużać i filtrować przerwy weekendowe.
- Włącz strukturę rynku i etykiety, aby zobaczyć HH/HL/LH/LL oraz aktualny trend/prognozę.
- Włącz strefy i wybierz preferowany tryb zakresu (pełny, korpus lub tylko knot).
- Jeśli chcesz sygnały, włącz sygnały wejścia, ustaw pasmo cofnięcia (np. 38,2–61,8%), bliskości i zachowanie potwierdzenia.
Nadal kontrolujesz zarządzanie ryzykiem i wykonanie – Market Structure Pro daje Ci uporządkowane, wizualne ramy, abyś mógł skupić się na podejmowaniu decyzji, a nie na rysowaniu.
Podsumowanie
It features auto-drawn zones based on the last Higher High and Lower Low source candles, with options for full candle, body only, or wick-only ranges. Smart entry signals include swing pullback entries using Fibonacci-style retracement bands and break-of-structure (BOS) pullbacks, both filtered by proximity and time since the swing or BOS event. A confirmation engine supports multiple modes such as close-in-favor, engulfing candles, or combined confirmations, with configurable confirmation timeframes and signal price options.
Visual and performance controls allow adjustment of label offsets, font sizes, opacity, and update frequency to maintain chart clarity and efficiency. Market Structure Pro supports various markets including Forex, indices, commodities, stocks, and cryptocurrencies, and is suitable for price-action, swing, and intraday traders seeking structured, rule-based analysis and entry signals without manual drawing.
Opinie klientów
5 | 33 % | |
4 | 67 % | |
3 | 0 % | |
2 | 0 % | |
1 | 0 % |


