

Opis
# VMM TRADE VISION LITE - Darmowe narzędzie do zarządzania pozycjami
## 📌 KLASYFIKACJA: TYLKO ANALITYCZNE / INFORMACYJNE
**TEN WSKAŹNIK JEST CZYSTO ANALITYCZNY I INFORMACYJNY**
- ❌ Nie wykonuje zleceń
- ❌ Nie modyfikuje pozycji
- ❌ Nie zarządza ryzykiem automatycznie
- ❌ Nie dostarcza sygnałów handlowych
- ✅ Dostarcza analizy pozycji w czasie rzeczywistym do ręcznego podejmowania decyzji
---
## 🎯 Przegląd
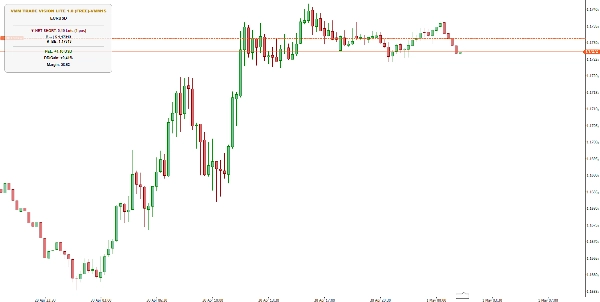
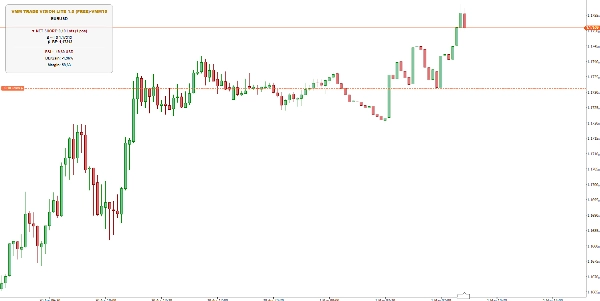
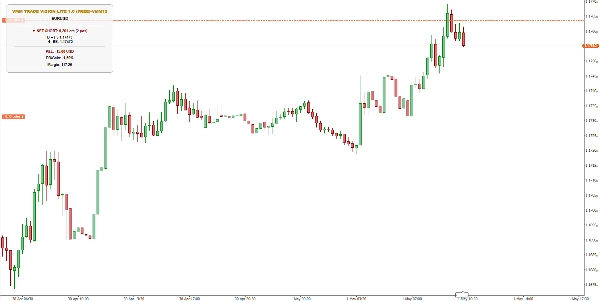
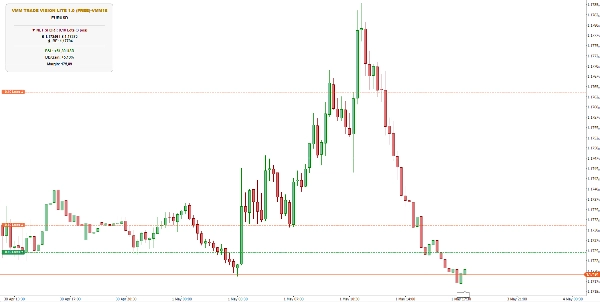
Profesjonalny wskaźnik śledzenia pozycji **analityczny** dla cTrader. Monitoruj całą swoją aktywność handlową na pierwszy rzut oka dzięki metrykom w czasie rzeczywistym, w tym pozycji NETTO, globalnemu Break-Even, średnim cenom wejścia, wykorzystaniu depozytu zabezpieczającego i procentowi obsunięcia kapitału.
**100% ANALITYCZNY - Zero automatycznego handlu**
---
## ✨ Kluczowe funkcje (tylko analityczne/wyświetlanie)
### 📊 Analiza pozycji
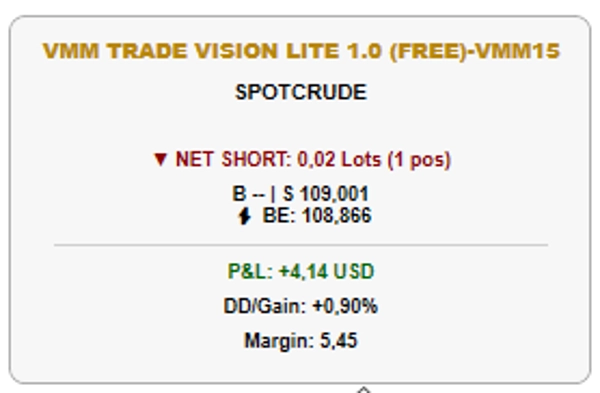
- **Pozycja NETTO**: Pokazuje całkowitą ekspozycję długą/krótką w lotach
- **Globalny Break-Even**: Oblicza ogólny punkt równowagi uwzględniając wszystkie pozycje, swapy i prowizje
- **Średnie ceny wejścia**: Indywidualne średnie kupna/sprzedaży z pełnym ważeniem lotów
- **Licznik aktywnych pozycji**: Śledzi ile pozycji jest otwartych
### 📈 Metryki wydajności
- **Zysk/Strata w czasie rzeczywistym**: Aktualny zysk/strata w walucie konta
- **Wykorzystany depozyt zabezpieczający**: Aktualna kwota depozytu w walucie konta
- **Obsunięcie/Zysk**: Procent od salda konta
### 🎨 Funkcje wizualne
- **Linie poziome**: Opcjonalne linie na wykresie dla BE i średnich (tylko odniesienie wizualne)
- **Dostosowywalne style linii**: Szerokość, styl i kolory
- **Inteligentne pozycjonowanie panelu**: 5 pozycji (LewyGórny, PrawyGórny, LewyDolny, PrawyDolny, ŚrodekDolny)
- **Automatyczne wykrywanie motywu**: Dostosowuje się do trybu ciemnego/jasnego
- **Kontrola przezroczystości**: Regulacja przezroczystości panelu (0-255)
---
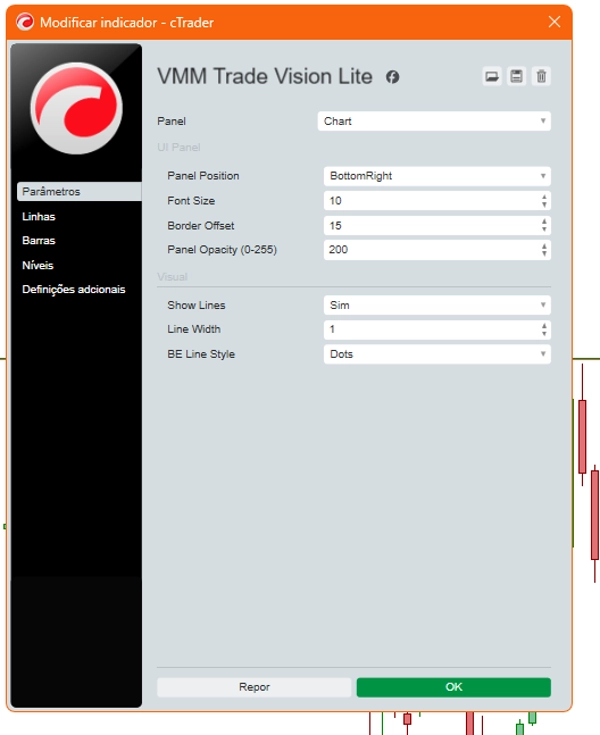
## ⚙️ Parametry
### Panel UI
Parametr | Opis | Domyślny
Pozycja panelu | Lokalizacja panelu informacyjnego na ekranie | LewyGórny
Rozmiar czcionki | Rozmiar tekstu (9-12) | 10
Przesunięcie obramowania | Odległość od krawędzi ekranu | 15
Przezroczystość panelu | Poziom przezroczystości (0-255) | 200
### Wizualne
Parametr | Opis | Domyślny
Pokaż linie | Wyświetl linie na wykresie (tylko wizualne) | true
Szerokość linii | Grubość linii (1-3) | 1
Styl linii BE | Styl linii Break-Even | Kropki
---
## 🚀 Jak używać
1. Dodaj wskaźnik do dowolnego wykresu **(tylko odczytuje dane)**
2. Otwieraj pozycje ręcznie na symbolu **(to Ty decydujesz, kiedy handlować)**
3. Panel automatycznie pokazuje **(tylko do informacji)**:
- Kierunek i wielkość pozycji NETTO
- Cenę Break-Even
- Aktualny zysk/stratę
- Wykorzystany depozyt zabezpieczający
4. **Używaj tych informacji do podejmowania WŁASNYCH decyzji handlowych**
---
## 💡 Idealne dla
- **Skalperów** śledzących wiele wejść
- **Traderów pozycyjnych** zarządzających złożonymi portfelami
- **Strategii hedgingowych** z przeciwstawnymi pozycjami
- **Traderów, którzy chcą jasnych danych ANALITYCZNYCH bez automatyzacji**
---
## 🔒 Za darmo na zawsze
Brak ograniczeń, brak okresów próbnych. Kompletny analityczny/informacyjny zestaw narzędzi do zarządzania pozycjami dostępny w 100% ZA DARMO!
---
## ⚖️ ZASTRZEŻENIE PRAWNE
**VMM TRADE VISION LITE to wyłącznie narzędzie ANALITYCZNE/INFORMACYJNE.**
Korzystając z tego wskaźnika, potwierdzasz, że:
1. Ten wskaźnik nie podejmuje automatycznych decyzji handlowych
2. Wszystkie decyzje kupna/sprzedaży pozostają wyłącznie Twoją odpowiedzialnością
3. Ten wskaźnik nie dostarcza sygnałów handlowych ani porad finansowych
4. Wyniki historyczne nie gwarantują przyszłych rezultatów
5. Handel na rynkach finansowych wiąże się z dużym ryzykiem utraty kapitału
**Zawsze handluj odpowiedzialnie i nigdy nie ryzykuj więcej, niż możesz sobie pozwolić stracić.**
---
## 📈 Ulepsz do ELITE
Uzyskaj dodatkowe premium **analityczne** funkcje:
- 🎯 Codzienny cel zysku z monitorowaniem postępów
- 📊 Wieloczasowe pivoty (H1/H4/D1)
- 🔔 Inteligentne powiadomienia wizualne (alerty celów/depozytu)
- ⚠️ Krytyczny alert poziomu depozytu (konfigurowalny próg z kodowaniem kolorów)
- ⭐ Odznaka statusu ELITE
*Wersja ELITE jest również wyłącznie ANALITYCZNA/INFORMACYJNA - bez wykonywania zleceń*
Wyszukaj **"VMM TRADE VISION ELITE"** w sklepie cTrader!
Podsumowanie
Opinie klientów
Dyskusja
Częste pytania
Więcej od tego autora
















Cena