
Breakout channel
Chỉ báo
523 lượt tải
Phiên bản 1.0, Nov 2025
Windows, Mac
Mô tả
Kênh Phá Vỡ
Nó làm gì
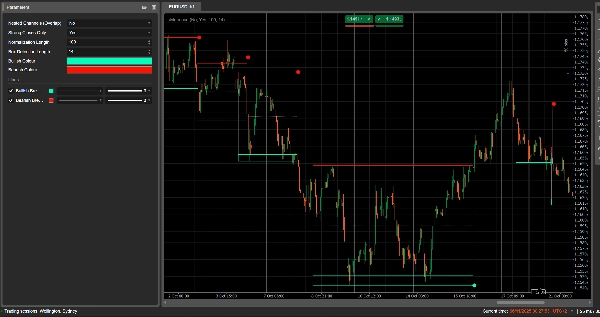
Kênh Phá Vỡ tự động phát hiện các phạm vi hợp nhất (các “hộp” giá) và đánh dấu điểm phá vỡ khi giá thoát khỏi các phạm vi đó.
Nó vẽ:
- Một hộp kênh màu xám xung quanh vùng hợp nhất
- Một dải trên màu đỏ (kháng cự tiềm năng)
- Một dải dưới màu xanh lá (hỗ trợ tiềm năng)
- Một đường giữa chấm trắng (điểm giữa kênh)
- Các chấm màu khi xảy ra phá vỡ:
-
- Chấm xanh lá/cyan dưới hộp → phá vỡ tăng giá
- Chấm đỏ trên hộp → phá vỡ giảm giá
Ý tưởng là để làm nổi bật trực quan các khu vực nơi giá đang cuộn lại và nơi các chuyển động mạnh có khả năng bắt đầu khi phạm vi bị phá vỡ.
Cách tính toán
- Chuẩn hóa giá
-
- Trong Độ dài Chuẩn hóa thanh gần nhất, nó tìm đỉnh cao nhất và đáy thấp nhất.
- Nó chuẩn hóa giá đóng cửa vào phạm vi 0–1:
normalizedPrice=Close−LowestLowHighestHigh−LowestLow\text{normalizedPrice} = \frac{\text{Close} - \text{LowestLow}}{\text{HighestHigh} - \text{LowestLow}}normalizedPrice=HighestHigh−LowestLowClose−LowestLow
- Đo lường biến động
-
- Nó tính toán độ lệch chuẩn của giá chuẩn hóa trong 14 thanh.
- Điều này tạo ra một chuỗi biến động được sử dụng để phát hiện các điểm quay trong cấu trúc thị trường.
- Các “đường biến động” trên / dưới
-
- Trong (Độ dài Phát hiện Hộp + 1) thanh gần nhất, nó tìm:
-
- thanh có biến động cao nhất
- thanh có biến động thấp nhất
- Từ số thanh trước đó mà các cực trị này xảy ra, nó xây dựng hai đường tổng hợp: Trên và Dưới.
- Giao cắt giữa các đường này báo hiệu khởi đầu/kết thúc tiềm năng của pha kênh.
- Bắt đầu & thời lượng kênh
-
- Khi Dưới cắt lên trên Trên, chỉ báo đánh dấu khởi đầu kênh tiềm năng.
- Từ thanh đó, nó theo dõi thời lượng và đỉnh cao nhất / đáy thấp nhất trong khoảng thời gian.
- Tạo kênh
-
- Khi sau đó Trên cắt xuống dưới Dưới, và thời lượng lớn hơn 10 thanh:
-
- Nó xác định Đỉnh của kênh là đỉnh cao nhất trong khoảng thời gian đó.
- Nó xác định Đáy của kênh là đáy thấp nhất.
- Nó đo ATR/2 hiện tại để phân tách một vùng mỏng ở trên và dưới:
-
- Dải đỏ ở trên (dải giảm giá)
- Dải xanh lá ở dưới (dải tăng giá)
- Nó vẽ:
-
- Hình chữ nhật viền màu xám (toàn bộ kênh)
- Viền trên màu đỏ
- Viền dưới màu xanh lá
- Một đường giữa chấm trắng xuyên qua trung tâm
- Các kênh vẫn tồn tại trên biểu đồ như cấu trúc lịch sử (chúng không bị xóa sau khi phá vỡ).
- Phát hiện phá vỡ
-
- Đối với mỗi kênh đang hoạt động, trên mỗi thanh mới nó tính toán một giá tham chiếu:
-
- Nếu Chỉ Đóng Mạnh = true → sử dụng điểm giữa thân nến:
refPrice=(Open+Close)/2\text{refPrice} = (\text{Open} + \text{Close})/2refPrice=(Open+Close)/2
Điều này yêu cầu hơn một nửa thân nến nằm ngoài hộp. - Nếu Chỉ Đóng Mạnh = false → sử dụng đơn giản Giá đóng cửa.
- Nếu Chỉ Đóng Mạnh = true → sử dụng điểm giữa thân nến:
- Quy tắc phá vỡ:
-
- Nếu
refPrice > Top→ phá vỡ tăng giá -
- Vẽ một chấm xanh lá tại Đáy của kênh.
- Vô hiệu hóa kênh này (ngừng mở rộng nó), nhưng hộp vẫn hiển thị.
- Nếu
refPrice < Bottom→ phá vỡ giảm giá -
- Vẽ một chấm đỏ tại Đỉnh của kênh.
- Vô hiệu hóa kênh.
- Nếu không, kênh vẫn hoạt động và cạnh phải của nó được mở rộng đến thanh hiện tại.
- Nếu
- Tùy chọn Kênh Lồng Nhau
-
- Nếu Kênh Lồng Nhau = true, nhiều kênh có thể chồng lên nhau về thời gian và giá.
- Nếu false, chỉ báo chặn việc tạo kênh mới chồng lên kênh đã tồn tại.
Cách đọc và sử dụng
- Hộp màu xám (kênh)
-
- Biểu thị một vùng hợp nhất / cân bằng nơi giá đã giao dịch trong một thời gian.
- Hộp càng dài và cao thì phạm vi càng quan trọng.
- Dải trên màu đỏ (vùng kháng cự)
-
- Phần trên của kênh, được nhấn mạnh trực quan như một vùng kháng cự tiềm năng.
- Các lần từ chối lặp lại gần dải này cho thấy áp lực bán trong phạm vi.
- Dải dưới màu xanh lá (vùng hỗ trợ)
-
- Phần dưới của kênh, được làm nổi bật như hỗ trợ tiềm năng.
- Các lần bật lại lặp lại cho thấy người mua đang bảo vệ cạnh dưới của phạm vi.
- Đường giữa chấm trắng
-
- Điểm giữa của kênh – một dạng “giá trị công bằng” cục bộ.
- Giá dao động quanh đường này biểu thị sự cân bằng; các chuyển động mạnh ra xa thường báo trước việc kiểm tra dải đối diện.
- Các chấm phá vỡ
-
- Chấm xanh lá dưới hộp:
-
- Giá đã đóng cửa mạnh mẽ trên đỉnh của kênh (hoặc đơn giản là đóng cửa trên, tùy thuộc vào Chỉ Đóng Mạnh).
- Gợi ý một phá vỡ tăng giá – khả năng bắt đầu một đợt tăng từ sự siết chặt biến động.
- Chấm đỏ trên hộp:
-
- Giá đã đóng cửa mạnh mẽ dưới đáy của kênh.
- Gợi ý một phá vỡ giảm giá – khả năng bắt đầu một đợt giảm.
- Cách sử dụng điển hình (cấp ý tưởng)
-
- Phá vỡ theo xu hướng
-
- Giao dịch theo hướng phá vỡ (mua sau chấm xanh lá, bán sau chấm đỏ), lý tưởng là kết hợp với xu hướng khung thời gian cao hơn hoặc các chỉ báo khác.
- Bộ lọc & xác nhận
-
- Sử dụng kênh và phá vỡ của nó chỉ như một bộ lọc cho chiến lược hiện có của bạn (ví dụ: chỉ thực hiện các thiết lập mua nếu tín hiệu cuối cùng là phá vỡ tăng giá).
- Đặt rủi ro
-
- Đối với các phá vỡ tăng giá, nhiều nhà giao dịch đặt điểm dừng bên trong hoặc ngay dưới kênh trước đó; đối với phá vỡ giảm, bên trong hoặc trên hộp.
Tóm tắt
Tóm tắt AI
Breakout Channels is a technical indicator designed to identify consolidation zones and signal potential price breakouts. It automatically detects price ranges where the market is coiling, marking these with a grey channel box that highlights the consolidation area. The indicator draws a red upper band indicating potential resistance, a green lower band indicating potential support, and a white dotted midline representing the channel midpoint or local fair value.
Breakout points are signaled by colored dots: a green or cyan dot below the box indicates a bullish breakout, while a red dot above signals a bearish breakout. The indicator calculates these zones by normalizing price data, measuring volatility through the standard deviation of normalized prices, and identifying volatility extremes to define channel start and duration.
Channels remain visible on the chart as historical structures even after breakouts. Users can enable nested channels to allow overlapping consolidation zones. Breakout detection uses either candle body midpoints or close prices, depending on settings, to confirm strong closes outside the channel.
Typical uses include trading in the breakout direction, filtering existing strategies, and placing risk stops near channel boundaries. The indicator supports various markets including forex, indices, commodities, stocks, and cryptocurrencies.
Hồ sơ chỉ báo
Đánh giá của khách hàng
0.0
Đánh giá: 0
Đánh giá của khách hàng
Sản phẩm này chưa có đánh giá nào. Bạn đã dùng thử chưa? Hãy là người đầu tiên chia sẻ với mọi người!
Thảo luận
Câu hỏi thường gặp
Signal
Indices
Commodities
GBPUSD
RSI
Bollinger
Fibonacci
Scalping
AI
XAUUSD
NAS100
MACD
BTCUSD
Forex
Breakout
EURUSD
NZDUSD
Martingale
Prop
ZigZag
Supertrend
Fair Value Gap
SMC
Crypto
Grid
Stocks
ATR
USDJPY
VWAP
Các sản phẩm có sẵn trên cTrader Store, bao gồm bot giao dịch, chỉ báo và plugin, được cung cấp bởi các nhà phát triển bên thứ ba và chỉ nhằm mục đích cung cấp thông tin và tiếp cận kỹ thuật. cTrader Store không phải là nhà môi giới và không cung cấp lời khuyên đầu tư, khuyến nghị cá nhân hay bất kỳ đảm bảo nào về hiệu suất trong tương lai.


Giá
42.11M
Khối lượng đã giao dịch
6.13M
Pip đạt được
229
Lượt bán
8.49K
Cài đặt miễn phí