
3 Bar Triangle by Linda Raschke
Indicatore
536 download
Versione 1.0, Sep 2024
Windows, Mac
5.0
Recensioni: 1
Descrizione
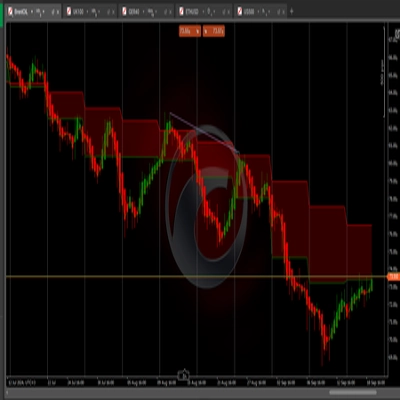
Questo modello suggerisce consolidamento o compressione del prezzo, dove il prezzo si contrae all'interno di un intervallo più ristretto. Il mercato si sta "avvolgendo" per un potenziale breakout in entrambe le direzioni, che solitamente porta a un movimento deciso una volta che rompe il triangolo.
Trading del Breakout:
- Entrata: I trader cercano un breakout sopra il massimo del modello o sotto il minimo del modello, indicando la direzione della mossa successiva.
- Stop-loss: Posizionare uno stop-loss al di fuori del lato opposto del triangolo (sia sopra il massimo che sotto il minimo) aiuta a gestire il rischio.
- Obiettivi: Alcuni trader puntano a un movimento del prezzo pari alla dimensione del triangolo (la distanza tra il massimo e il minimo della prima barra)
Riepilogo
Riepilogo AI
The 3 Bar Triangle indicator by Linda Raschke identifies a consolidation pattern where price contracts within a narrowing range, forming a "triangle" shape over three bars. This pattern signals market "coiling," indicating potential for a sharp breakout in either direction once price moves beyond the triangle boundaries. Traders use this indicator to time entries by watching for a breakout above the pattern’s high or below its low, which suggests the direction of the next price move. Risk management involves placing stop-loss orders just outside the opposite side of the triangle to limit potential losses. Profit targets are often set based on the size of the triangle, aiming for a price movement equal to the distance between the high and low of the initial bar. This indicator supports breakout trading strategies by highlighting periods of price squeezing and potential volatility expansion.
Profilo indicatore
Recensioni dei clienti
5.0
Recensioni: 1
5 | 100 % | |
4 | 0 % | |
3 | 0 % | |
2 | 0 % | |
1 | 0 % |
Recensioni dei clienti
August 12, 2025
Pros: Identifies classic 3-bar triangle consolidation zones. Simple setup, visually clear. Stable across timeframes. Cons: No alerts or tooltips. Lacks volume filters and signal confirmation. Limited customization
Discussioni
Domande frequenti
Breakout
I prodotti disponibili tramite cTrader Store, inclusi bot di trading, indicatori e plugin, sono forniti da sviluppatori terzi e resi disponibili esclusivamente a scopo informativo e di accesso tecnico. cTrader Store non è un broker e non fornisce consulenze in materia di investimento, raccomandazioni individualizzate o garanzie di risultati futuri.
Altro da questo autore


Prezzo
Da 19/09/2024
314.61K
Volume negoziato
258.47K
Profitto in pip
536
Installazioni gratuite