

Описание
Vice TrendTrading
«Продвинутые зоны тренда и точные стрелки входа на основе логики тренда на нескольких таймфреймах»
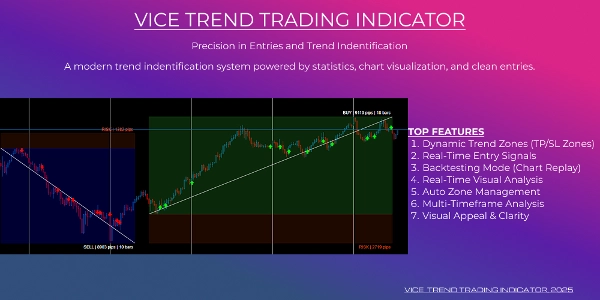
Это не просто очередной индикатор тренда — это полная визуальная торговая система, созданная, чтобы помочь вам находить рыночный тренд, отслеживать рыночную динамику в реальном времени и анализировать результаты тренда с ясностью.
Этот продвинутый инструмент объединяет анализ тренда на нескольких таймфреймах, наложения прибыли/убытка в реальном времени и автоматические стрелки сигналов в одном чистом и мощном графическом интерфейсе.
Ключевые особенности:
1. Динамические зоны тренда (визуализация TP/SL)
Сводка
ИИ-сводка
Vice TrendTrading is a comprehensive visual trading indicator designed to identify and track market trends using multi-timeframe analysis. It provides dynamic trend zones that visually mark entry areas, take profit targets, and stop loss levels with high precision. These zones update in real time, displaying profit and loss metrics in dollars, pips, and percentages.
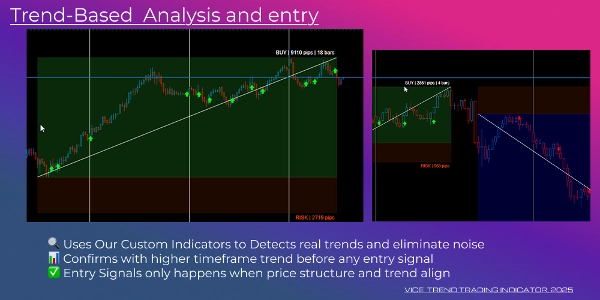
The system includes automatic signal arrows that confirm valid buy and sell entries within active trend zones, ensuring signals appear only at valid entry points without repainting or duplication. It supports historical signal reconstruction for chart replay, allowing users to visually backtest and analyze past market behavior accurately.
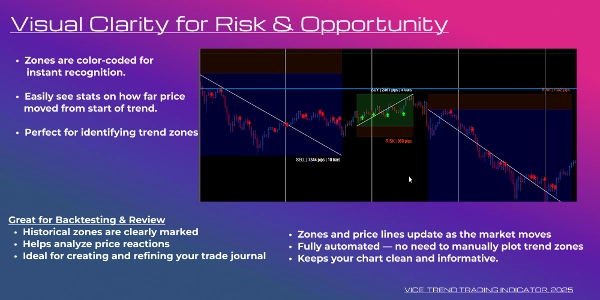
Vice TrendTrading manages trend zones automatically by closing and labeling completed zones when trends reverse, maintaining clean and organized charts even in volatile conditions. The indicator features color-coded zones and arrows with annotated profit/loss values for clarity and ease of interpretation.
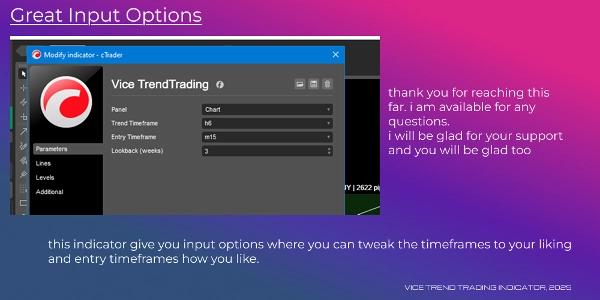
It works on all symbols and any timeframe, with customizable input parameters for trend and entry timeframes. This tool is suited for price action traders, discretionary traders, strategy developers, and anyone seeking a structured, modern chart to make informed trading decisions.
The system includes automatic signal arrows that confirm valid buy and sell entries within active trend zones, ensuring signals appear only at valid entry points without repainting or duplication. It supports historical signal reconstruction for chart replay, allowing users to visually backtest and analyze past market behavior accurately.
Vice TrendTrading manages trend zones automatically by closing and labeling completed zones when trends reverse, maintaining clean and organized charts even in volatile conditions. The indicator features color-coded zones and arrows with annotated profit/loss values for clarity and ease of interpretation.
It works on all symbols and any timeframe, with customizable input parameters for trend and entry timeframes. This tool is suited for price action traders, discretionary traders, strategy developers, and anyone seeking a structured, modern chart to make informed trading decisions.
Профиль индикатора
Обсуждение
Отзывы покупателей
4.6
Отзывы: 3
5 | 67 % | |
4 | 33 % | |
3 | 0 % | |
2 | 0 % | |
1 | 0 % |
Отзывы покупателей
July 18, 2025
Two sessions say more than one clean chart, and the market read feels cleaner.
July 15, 2025
not perfect, but the workflow felt cleaner, and A small account test feels safer.
July 7, 2025
Not perfect, but the workflow felt cleaner. It needs a few bad trades in the sample too.
Частые вопросы
Продукты, доступные в cTrader Store, включая торговых ботов, индикаторы и плагины, предоставляются сторонними разработчиками и доступны исключительно в информационных и технических целях. cTrader Store не является брокером и не предоставляет инвестиционные консультации, персональные рекомендации или какие-либо гарантии будущей доходности.

















Цена

С 17/06/2025