
説明
チャート上で有効にするにはAlt + ドラッグしてください。
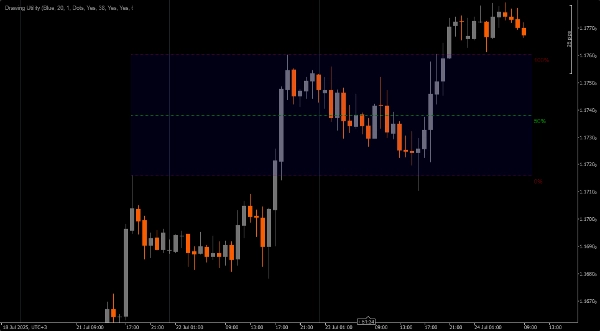
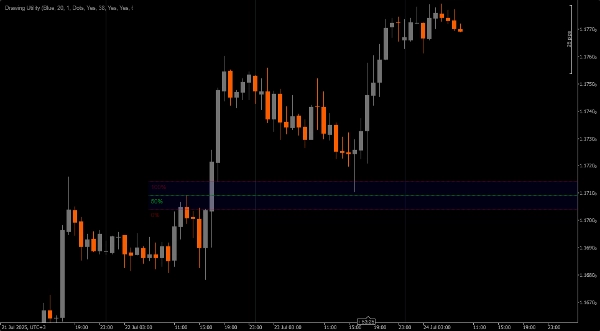
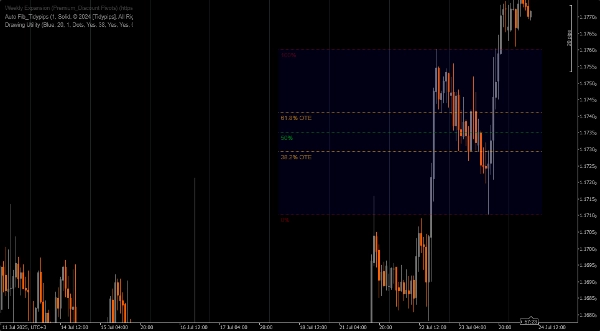
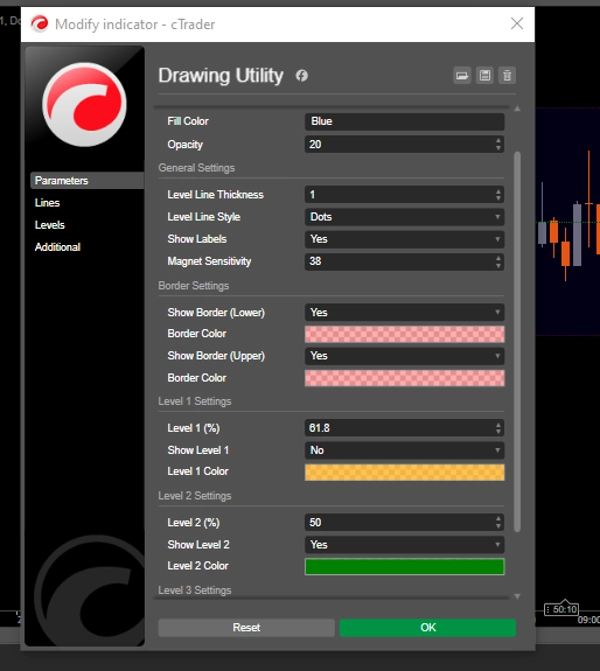
カスタマイズ可能な描画ツール。
1. クイックアクセスフィボナッチ。
2. フェアバリューギャップマーカー
3. 測定ツール
4. 注目ポイントマーカー
5. またはその他(私が考えていない)チャートに注釈を付けるのに適しているかもしれない用途
注意 **チャート上で有効にするにはAlt + ドラッグしてください。**
概要
インジケーターのプロフィール
カスタマーレビュー
0.0
レビュー: 0
カスタマーレビュー
この商品にはまだレビューがありません。お使いになったことがある方は、ぜひレビューをお願いします。
ディスカッション
よくあるご質問
cTrader Storeで入手可能な取引ボット、インジケーター、プラグインなどの商品は、第三者の開発者が提供するものであり、情報と技術の取得のみを目的としてご利用いただけます。cTrader Storeはブローカーではなく、投資助言や個人的な推奨を行うことも、将来のパフォーマンスを保証することもありません。
この作成者の他の商品


これも好きかも


価格
15
販売
4.56K
無料インストール