

说明
该工具允许用户指定分析的时间范围,例如每日,并在图表上绘制高点和低点,颜色、样式和粗细均可自定义。它支持多个前几天的数据,便于识别重要的价格动作区域。该指标还具有可选标签以提高清晰度,帮助交易者根据历史价格数据做出明智的决策。适合新手和有经验的交易者,该工具增强了市场分析和交易策略。
功能
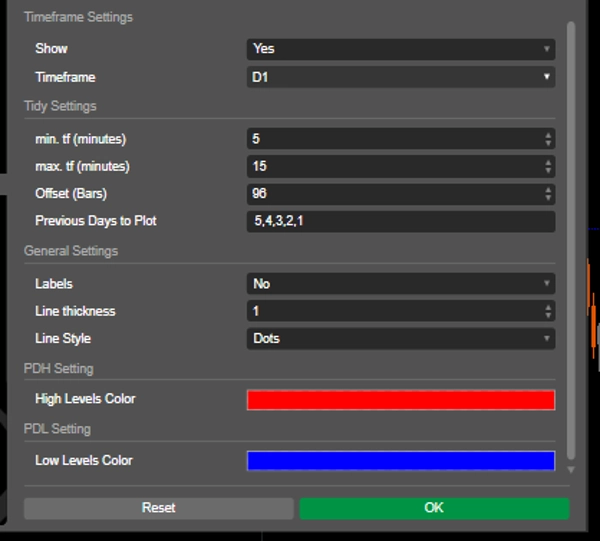
可自定义时间范围:用户可以选择特定的时间范围(例如每日)来分析之前的高点和低点,实现符合其交易策略的定制化可视化。
多个前几天:能够绘制多个前几天的高点和低点,提供对重要价格动作区域的全面视图。
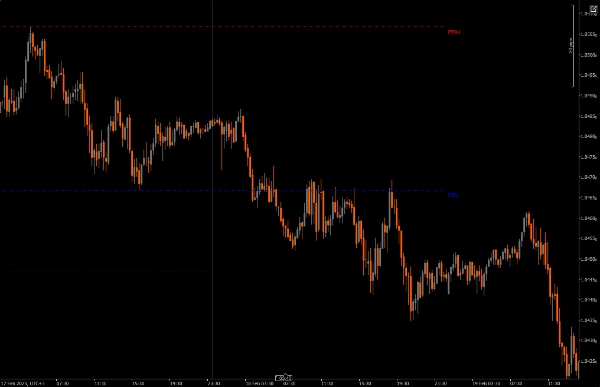
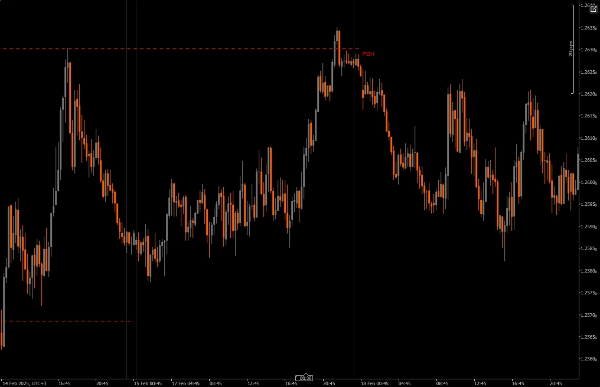
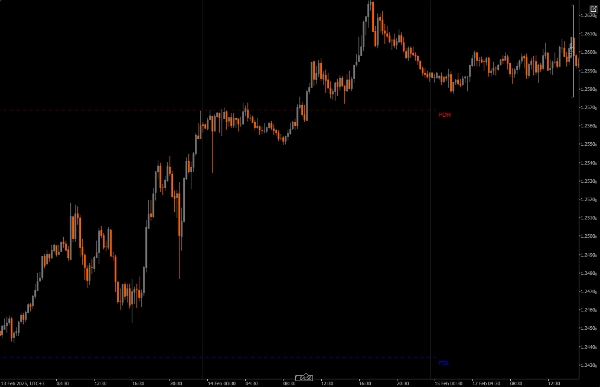
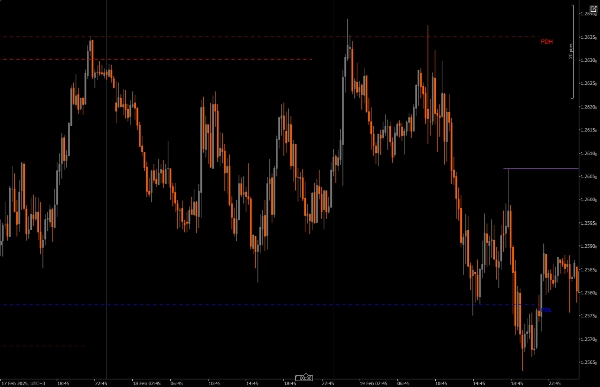
动态趋势线:该指标绘制前一天的高点和低点趋势线,便于一目了然地识别潜在的反转区域。
标签选项:用户可以启用标签,直接在图表上显示当前的高点和低点值,增强清晰度和理解。
视觉自定义:交易者可以自定义线条颜色、样式和粗细,以符合个人偏好并提高图表的可读性。
时间范围限制:该指标确保仅在指定的最小和最大时间范围设置内运行,减少切换其他时间范围时的图表杂乱。
注意事项
市场中的PDH或PDL可用作流动性绘制(DOL)或用于构建反转框架。
当未能突破时,反转可以基于PDH和PDL构建。
当价格尊重上方或下方的PD数组,未能突破每日高点或低点时,可以预期下一根蜡烛。
价格更可能达到前一天的高点还是低点?当使用PDH PDL作为流动性绘制(DOL)时。
安装:在您的cAlgo平台上下载并安装每日范围流动性区域(PDH PDL)。
设置:打开指标设置,选择您想要分析的时间范围、绘制的前几天数量,并自定义线条颜色和粗细等视觉参数。
使用指标:指标将根据指定设置自动在图表上绘制前一天的高点和低点。
分析:在交易时观察绘制的水平线。利用这些水平线构建潜在反转,并做出明智的交易决策。
推荐配套工具
cTrader:cAlgo的原生平台,提供无缝的环境用于使用和自定义指标。
技术分析工具:将此指标与其他工具如公平价值缺口(FVG)和反转模式指标(CRT)结合使用,以增强您的交易策略和市场分析。
风险管理工具:利用仓位大小计算器和止损工具,有效管理围绕识别的高点和低点的交易风险。
通过将每日范围流动性区域(PDH PDL)与这些工具集成,交易者可以增强市场分析,提高在复杂价格动作中取得成功的机会。
摘要
客户评价
5 | 100 % | |
4 | 0 % | |
3 | 0 % | |
2 | 0 % | |
1 | 0 % |


